Fig. 8.
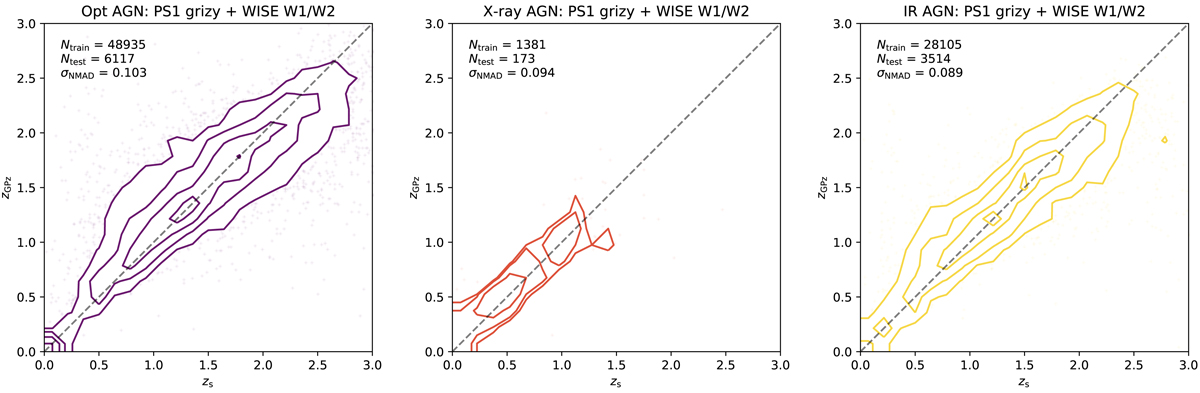
Distribution of GPZ photometric redshift estimates vs. spectroscopic redshift for the test sample (not included in training in any way) for the three AGN subsamples; optically identified quasars (left panel), X-ray selected AGN (centre panel) and WISE infrared selected AGN (right panel). The number of training sources used (Ntrain), the number of test sources plotted (Ntest) and the corresponding robust scatter for the test sample (σNMAD) are shown in the upper left corner of each panel. The plotted contours are linearly spaced in source density.
Current usage metrics show cumulative count of Article Views (full-text article views including HTML views, PDF and ePub downloads, according to the available data) and Abstracts Views on Vision4Press platform.
Data correspond to usage on the plateform after 2015. The current usage metrics is available 48-96 hours after online publication and is updated daily on week days.
Initial download of the metrics may take a while.