Fig. 16.
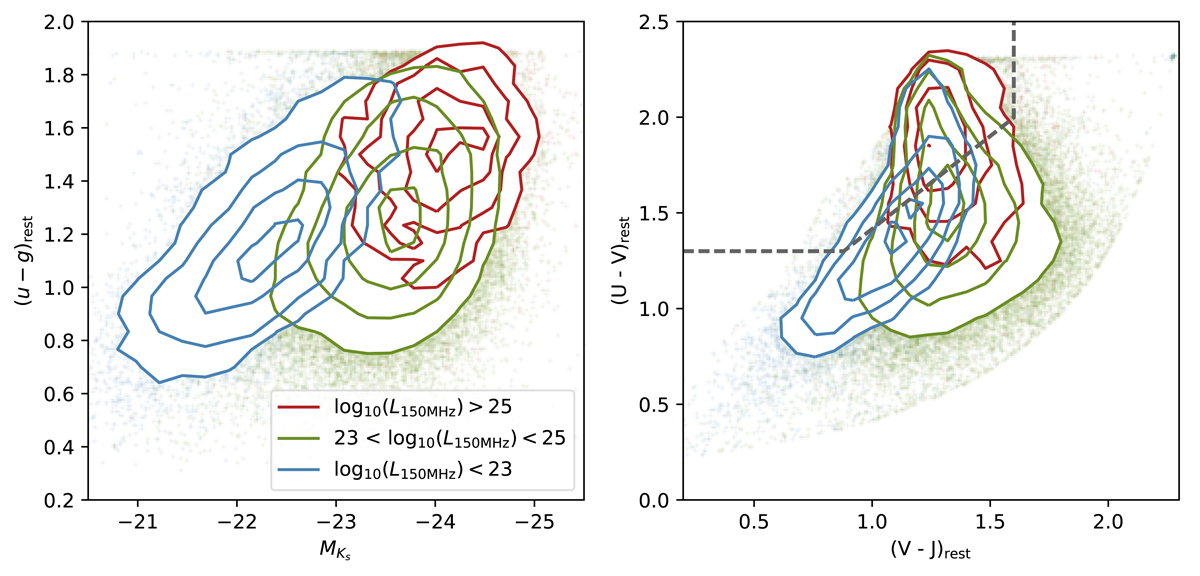
Left panel: observed colour-magnitude distribution, u − g vs. MKs of the 0.1 < z < 0.8 in three bins of radio luminosity (in W Hz−1) for the LOFAR selected sources that are not classified as optical, IR or X-ray AGN. The most luminous radio sources are hosted in galaxies that are red and bright in the near-IR (a strong proxy for stellar mass). Right panel: rest-frame U − V vs. V − J optical colours for the LOFAR detected population for the same bins in radio luminosity. The black dashed line shows the typical boundary used to separate star-forming and quiescent stellar populations (e.g. Williams et al. 2009).
Current usage metrics show cumulative count of Article Views (full-text article views including HTML views, PDF and ePub downloads, according to the available data) and Abstracts Views on Vision4Press platform.
Data correspond to usage on the plateform after 2015. The current usage metrics is available 48-96 hours after online publication and is updated daily on week days.
Initial download of the metrics may take a while.