Fig. 13.
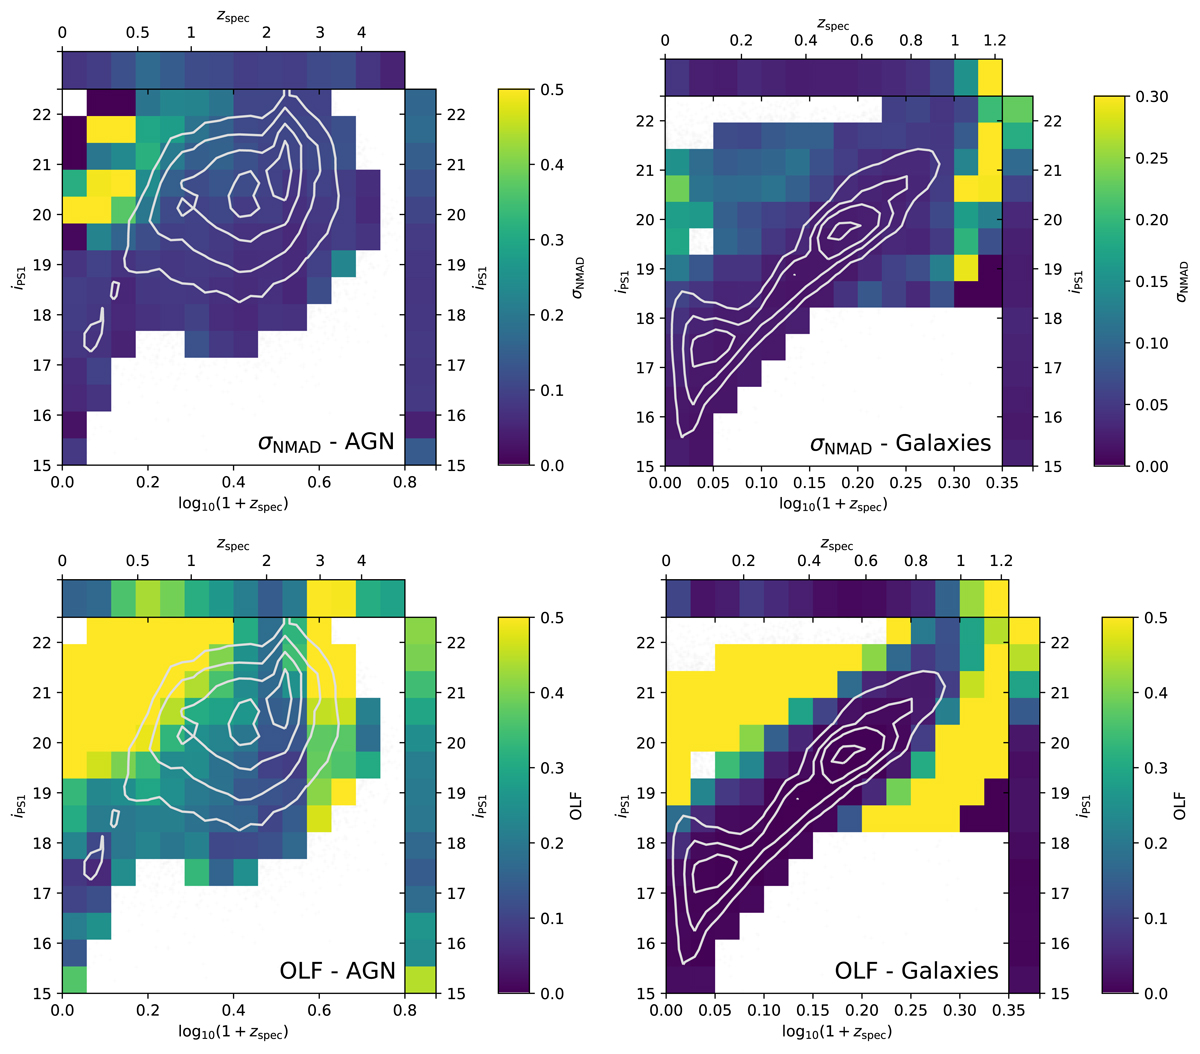
Robust scatter (σNMAD; upper panels) and outlier fraction (OLF; lower panels) for the consensus photo-z estimate (z1, median) as a function of spectroscopic redshift and apparent iPS1 magnitude. For the AGN subset (left panels) each cell corresponds to a minimum of 30 sources with the colour of the cell representing the scatter of that subset. For the galaxy plots (right panels) each cell corresponds to a minimum of 100 sources. The top and side bar of each panel shows the trends in σNMAD or OLF averaged over all magnitudes and redshifts respectively. For reference, we also plot the distribution of the spectroscopic training sample within this parameter space as grey contours – plotted contours are linearly spaced in source density.
Current usage metrics show cumulative count of Article Views (full-text article views including HTML views, PDF and ePub downloads, according to the available data) and Abstracts Views on Vision4Press platform.
Data correspond to usage on the plateform after 2015. The current usage metrics is available 48-96 hours after online publication and is updated daily on week days.
Initial download of the metrics may take a while.