Fig. 11.
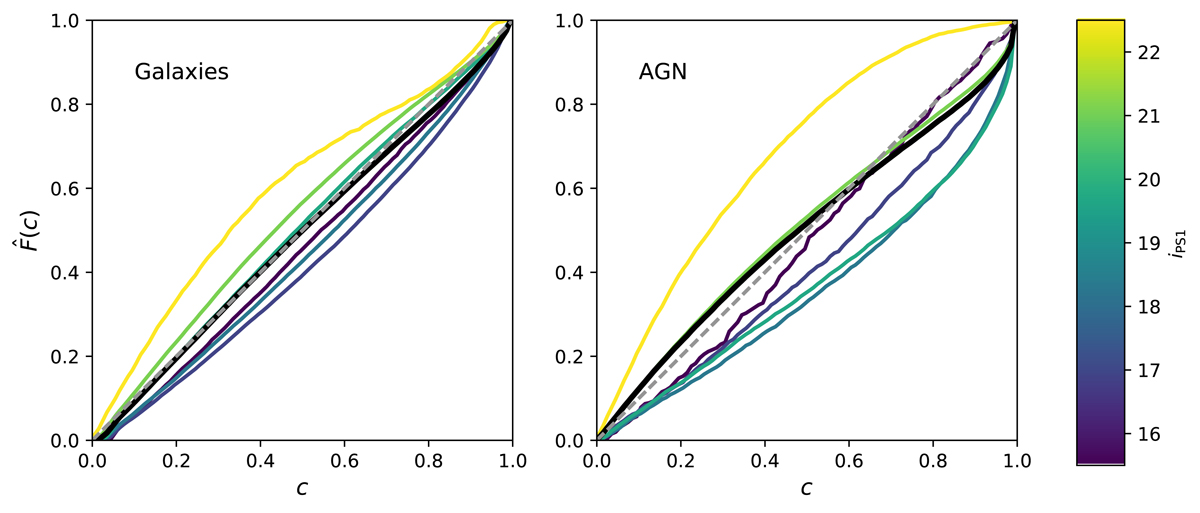
Q–Q (![]() , see text in Sect. 3.1) plots for the final calibrated consensus redshift predictions for the galaxy population (left panel) and the optical/infrared and X-ray selected AGN population (right panel). Coloured lines represent the distributions in bins of apparent optical magnitude while the thick black line corresponds to the complete spectroscopic training sample. Lines that fall above the 1:1 relation illustrate under-confidence in the photo-z uncertainties (uncertainties overestimated) while lines under illustrate over-confidence (uncertainties underestimated).
, see text in Sect. 3.1) plots for the final calibrated consensus redshift predictions for the galaxy population (left panel) and the optical/infrared and X-ray selected AGN population (right panel). Coloured lines represent the distributions in bins of apparent optical magnitude while the thick black line corresponds to the complete spectroscopic training sample. Lines that fall above the 1:1 relation illustrate under-confidence in the photo-z uncertainties (uncertainties overestimated) while lines under illustrate over-confidence (uncertainties underestimated).
Current usage metrics show cumulative count of Article Views (full-text article views including HTML views, PDF and ePub downloads, according to the available data) and Abstracts Views on Vision4Press platform.
Data correspond to usage on the plateform after 2015. The current usage metrics is available 48-96 hours after online publication and is updated daily on week days.
Initial download of the metrics may take a while.