Fig. 6.
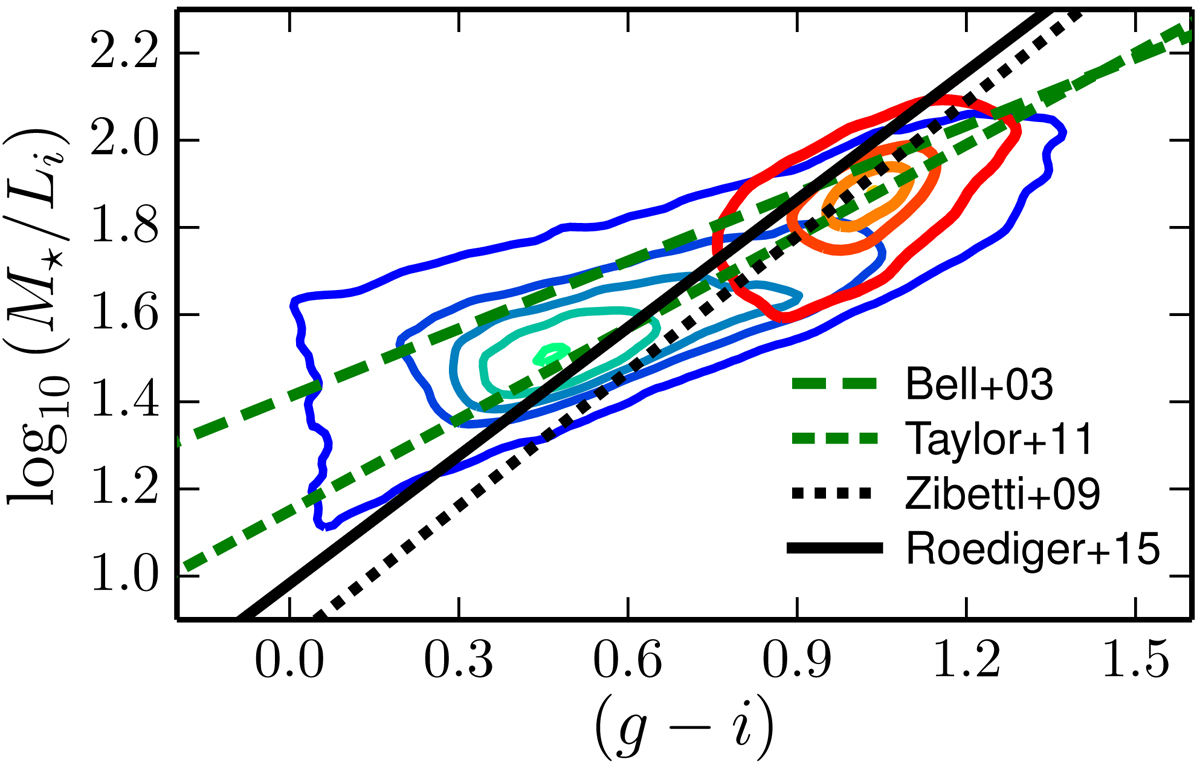
Comparison of the observed mass-to-light ratio versus (g − i) colour in ALHAMBRA with MLCRs from the literature. The contours are the same as in Fig. 2. The dashed green line is from the observational study of T11. The other black lines are from theoretical expectations: Zibetti et al. (2009, dotted) and Roediger & Courteau (2015, solid). All the MLCRs have been scaled to a Chabrier (2003) IMF and referred to BC03 models.
Current usage metrics show cumulative count of Article Views (full-text article views including HTML views, PDF and ePub downloads, according to the available data) and Abstracts Views on Vision4Press platform.
Data correspond to usage on the plateform after 2015. The current usage metrics is available 48-96 hours after online publication and is updated daily on week days.
Initial download of the metrics may take a while.