Fig. 5.
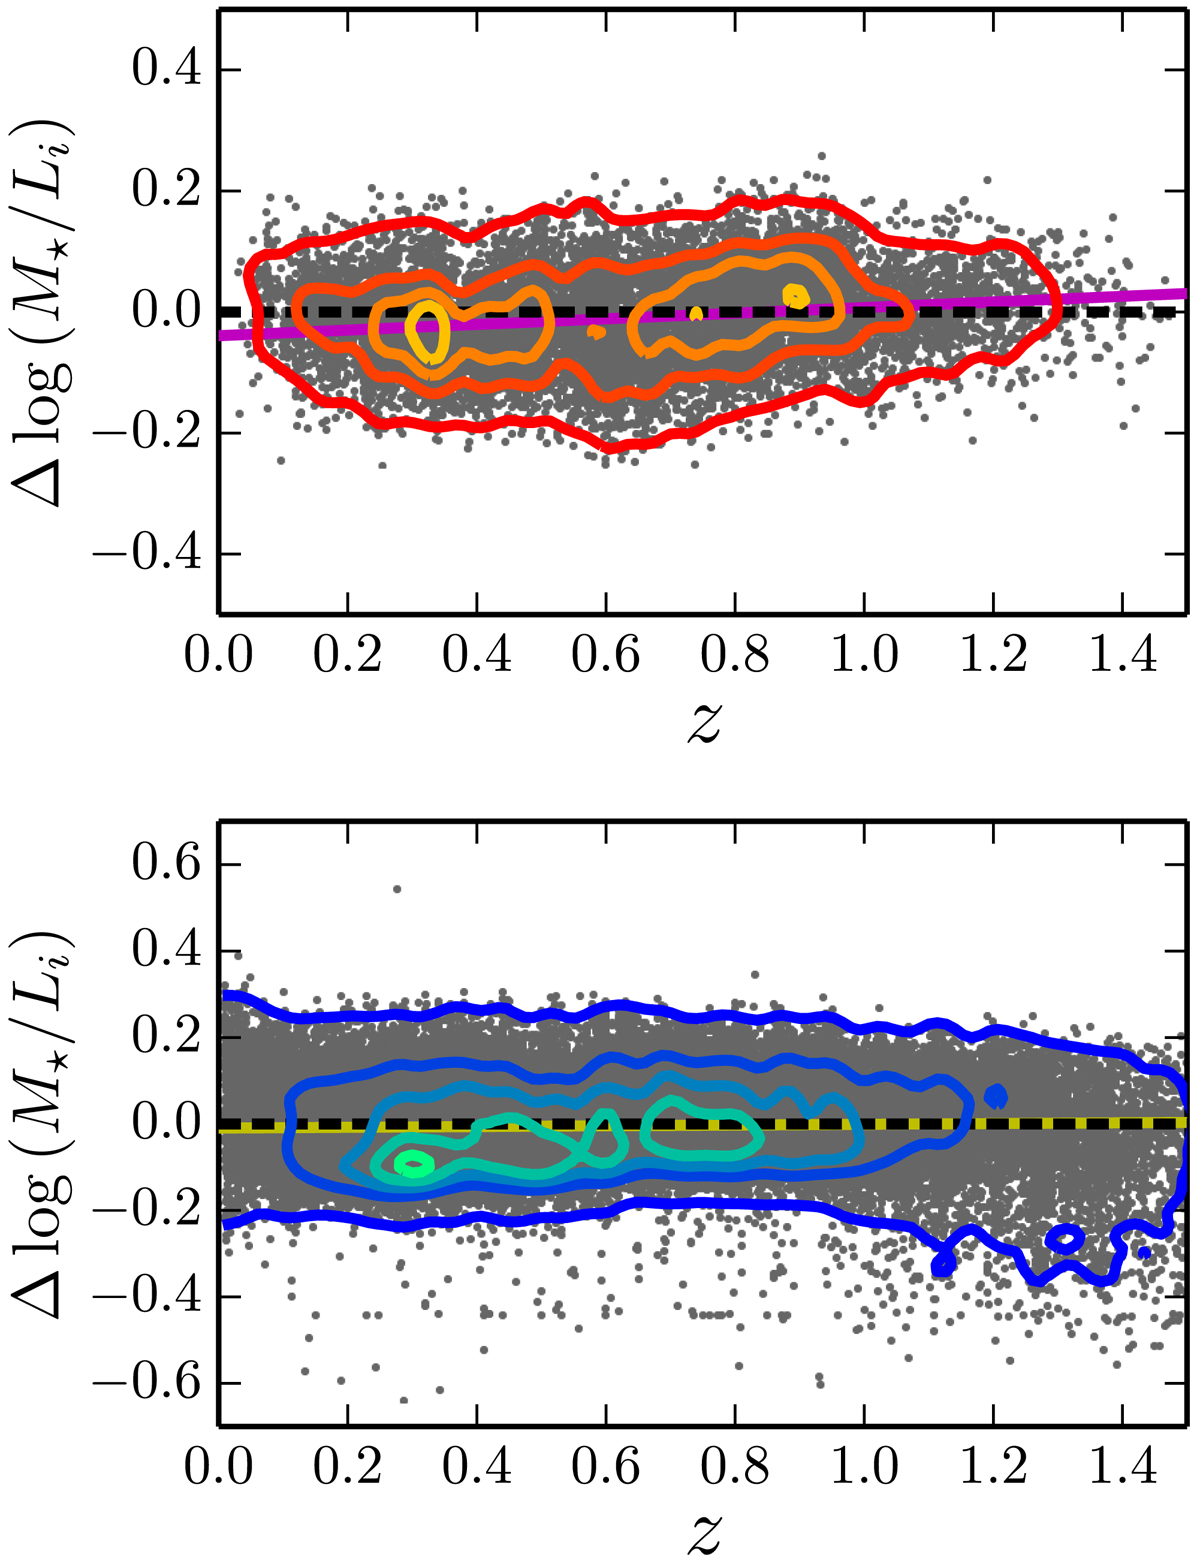
Comparison between the observed ALHAMBRA mass-to-light ratio and the expected ratio from our median relation as a function of redshift for quiescent (top panel) and star-forming (bottom panel) galaxies with F814W ≤ 23 (grey dots). The solid contours show levels in the number of galaxies, starting at one galaxy and increasing in steps of five galaxies for quiescent galaxies, and in steps of 15 galaxies for star-forming galaxies. The dashed lines mark null difference. The solid lines show the linear fit to the mass-to-light ratio residuals, ΔΥQ ∝ 0.04z (top panel) and ΔΥSF ∝ 0.01z (bottom panel).
Current usage metrics show cumulative count of Article Views (full-text article views including HTML views, PDF and ePub downloads, according to the available data) and Abstracts Views on Vision4Press platform.
Data correspond to usage on the plateform after 2015. The current usage metrics is available 48-96 hours after online publication and is updated daily on week days.
Initial download of the metrics may take a while.