Fig. 4.
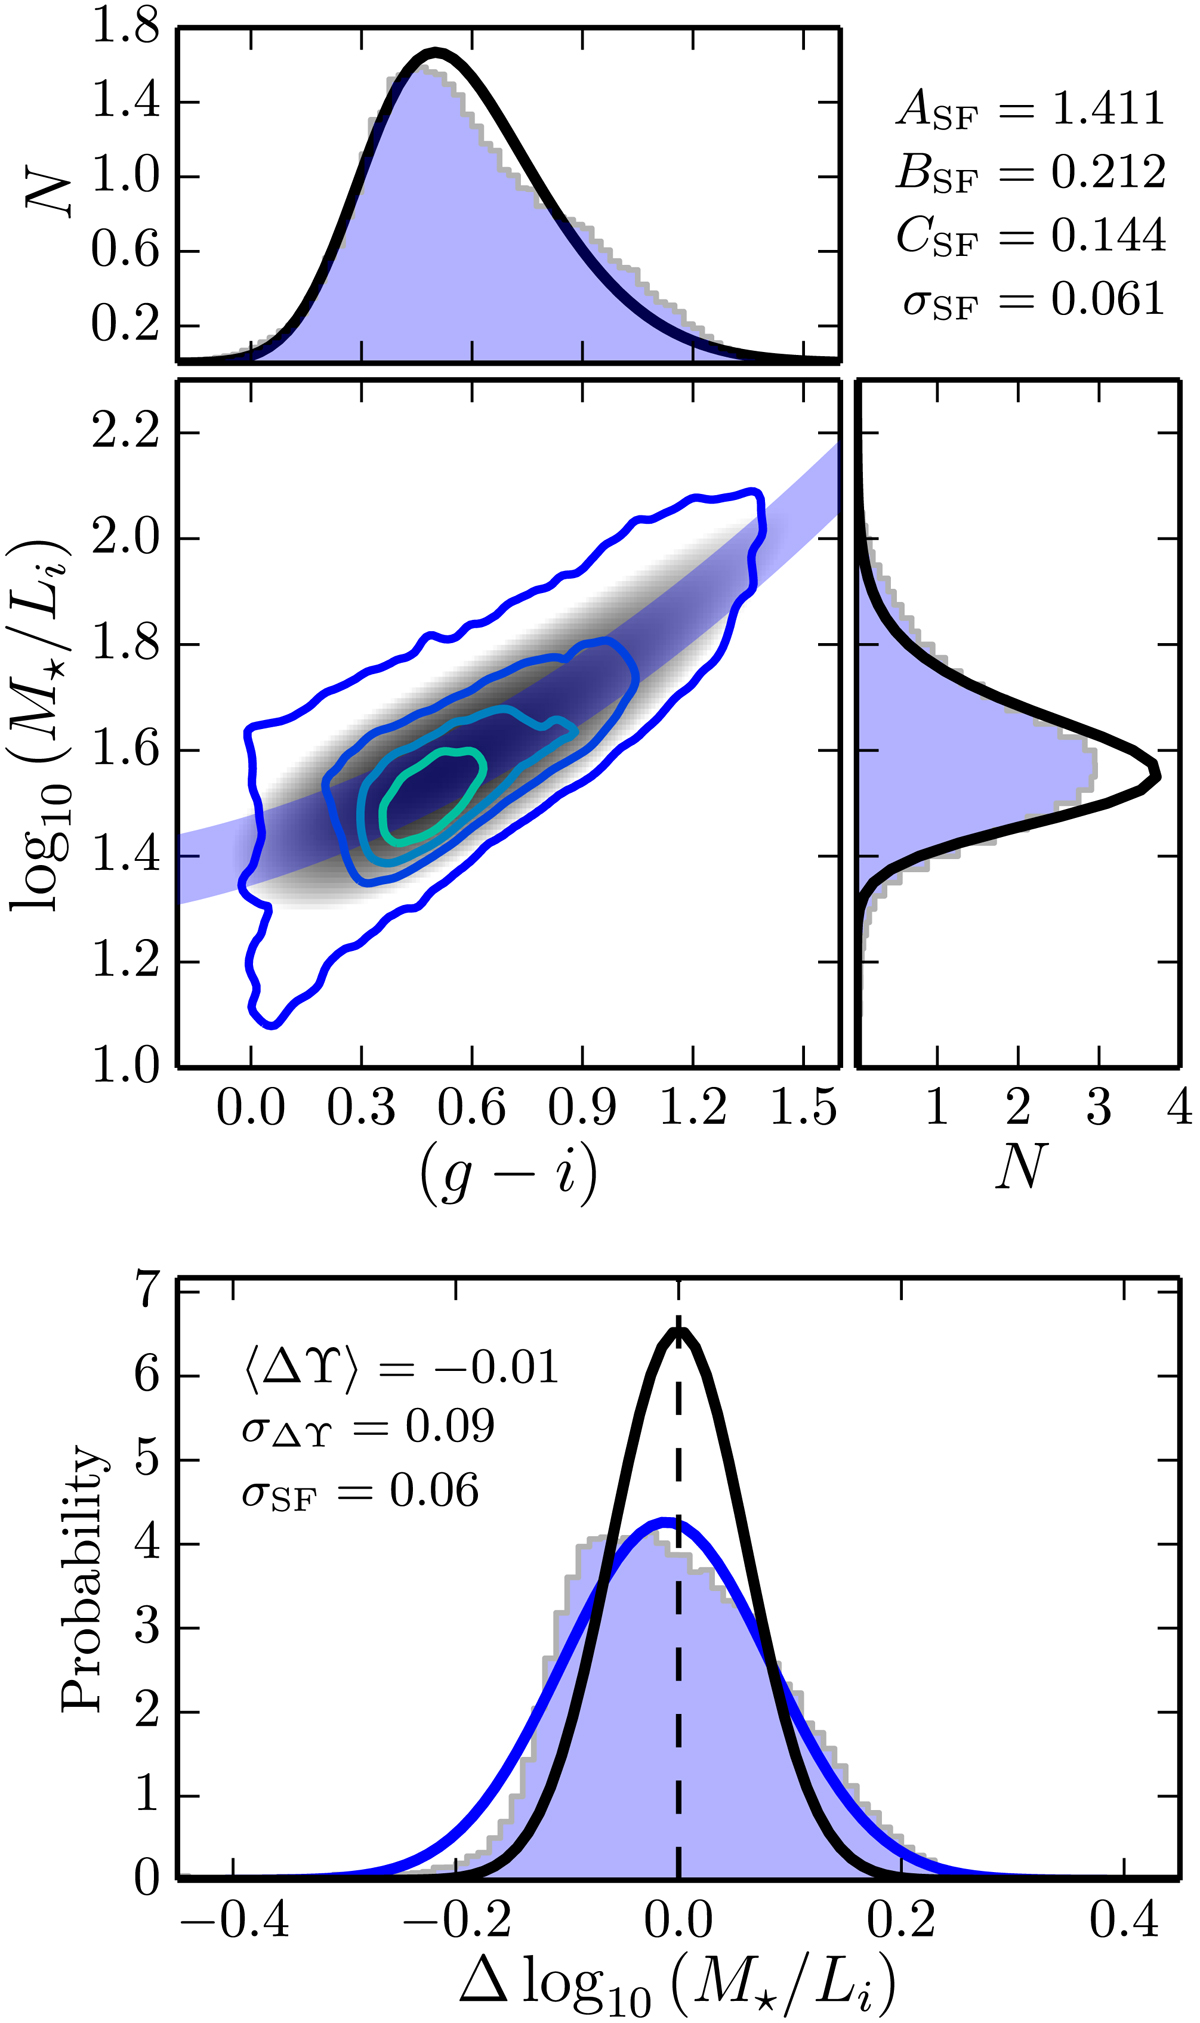
Top panel: mass-to-light ratio M⋆/Li as a function of the rest-frame colour g − i for the 63737 ALHAMBRA star-forming galaxies with F814W ≤ 23 at z < 1.5. The solid lines show level contours in the density of galaxies as in Fig. 2. The grey scale shows the median fitting model to the data, ![]() . The blue area represents the derived MLCR, log10 (M⋆/Li)=1.411 + 0.212(g − i)+0.144(g − i)2, and its 1σ intrinsic dispersion, σSF = 0.06. Side panels: normalised projected histogram in g − i (upper panel) and log10 (M⋆/Li) (right panel). In both panels the observed distribution is presented in filled blue, and the derived median model in solid black. Bottom panel: comparison between the observed ALHAMBRA mass-to-light ratio and that expected from our median relation (blue filled histogram). The blue solid line is the best Gaussian fit with median ⟨ΔΥ⟩ = − 0.01 and σΔΥ = 0.09. The black solid line illustrates the estimated intrinsic dispersion unaffected by observational uncertainties.
. The blue area represents the derived MLCR, log10 (M⋆/Li)=1.411 + 0.212(g − i)+0.144(g − i)2, and its 1σ intrinsic dispersion, σSF = 0.06. Side panels: normalised projected histogram in g − i (upper panel) and log10 (M⋆/Li) (right panel). In both panels the observed distribution is presented in filled blue, and the derived median model in solid black. Bottom panel: comparison between the observed ALHAMBRA mass-to-light ratio and that expected from our median relation (blue filled histogram). The blue solid line is the best Gaussian fit with median ⟨ΔΥ⟩ = − 0.01 and σΔΥ = 0.09. The black solid line illustrates the estimated intrinsic dispersion unaffected by observational uncertainties.
Current usage metrics show cumulative count of Article Views (full-text article views including HTML views, PDF and ePub downloads, according to the available data) and Abstracts Views on Vision4Press platform.
Data correspond to usage on the plateform after 2015. The current usage metrics is available 48-96 hours after online publication and is updated daily on week days.
Initial download of the metrics may take a while.