Fig. 2.
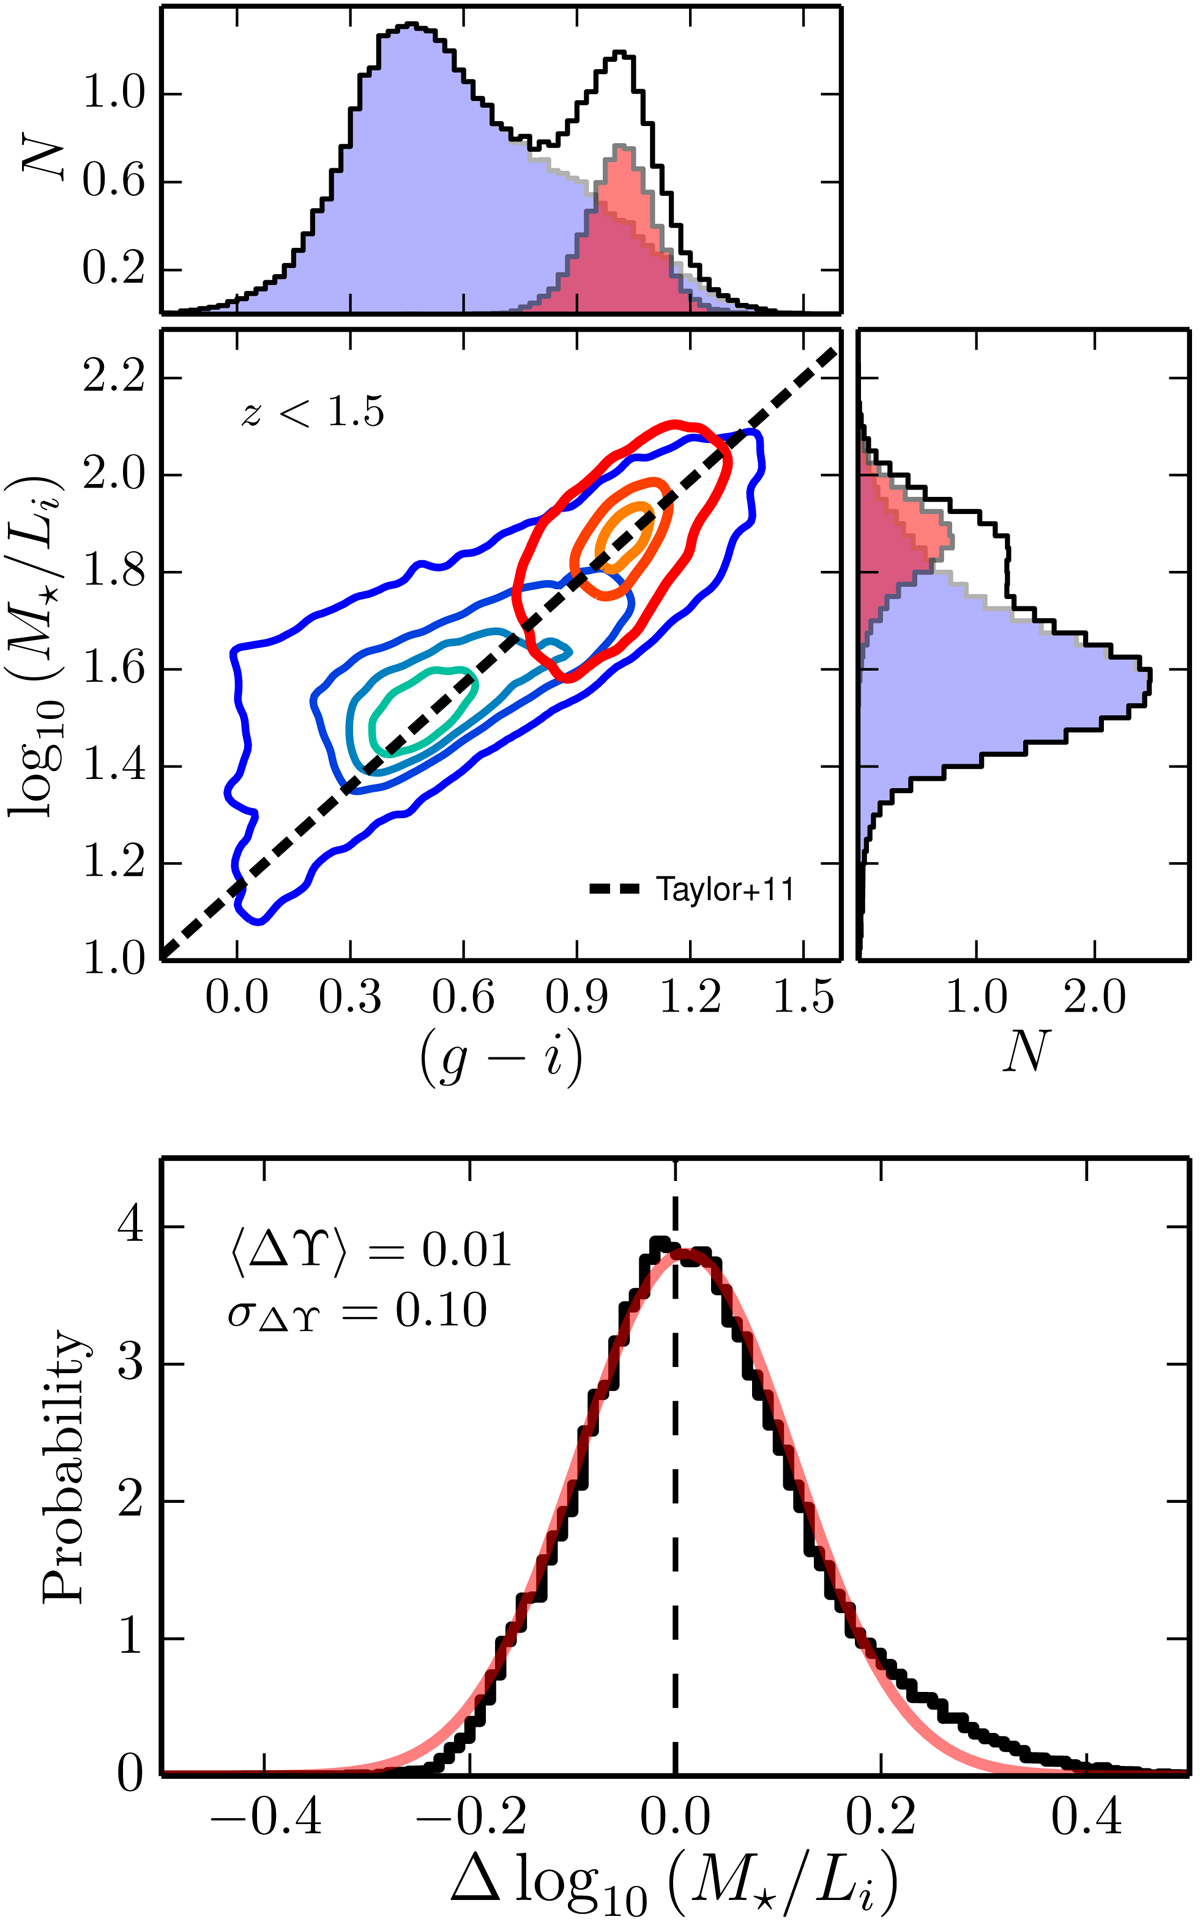
Top panel: mass-to-light ratio M⋆/Li as a function of the rest-frame colour g − i for the 76642 ALHAMBRA galaxies with F814W ≤ 23 at z < 1.5. The coloured lines show level contours in the density of galaxies, starting at 0.1 galaxies dex−2 and increasing in 1.5 galaxies dex−2 steps. Red contours show the quiescent population, and blue contours the star-forming one. The side panels show the normalised distribution in g − i (upper panel) and log10 (M⋆/Li) (right panel). In both panels the total distribution is presented in black, the quiescent population in filled red, and the star-forming population in filled blue. The black dashed line marks the relation derived by Taylor et al. (2011) at z < 0.65 using GAMA galaxies and SDSS five-band photometry. Bottom panel: comparison between the observed ALHAMBRA mass-to-light ratio and that expected from the Taylor et al. (2011) relation. The red solid line is the best Gaussian fit with median ⟨ΔΥ⟩ = 0.01 dex and dispersion σΔΥ = 0.10 dex.
Current usage metrics show cumulative count of Article Views (full-text article views including HTML views, PDF and ePub downloads, according to the available data) and Abstracts Views on Vision4Press platform.
Data correspond to usage on the plateform after 2015. The current usage metrics is available 48-96 hours after online publication and is updated daily on week days.
Initial download of the metrics may take a while.