Fig. 6.
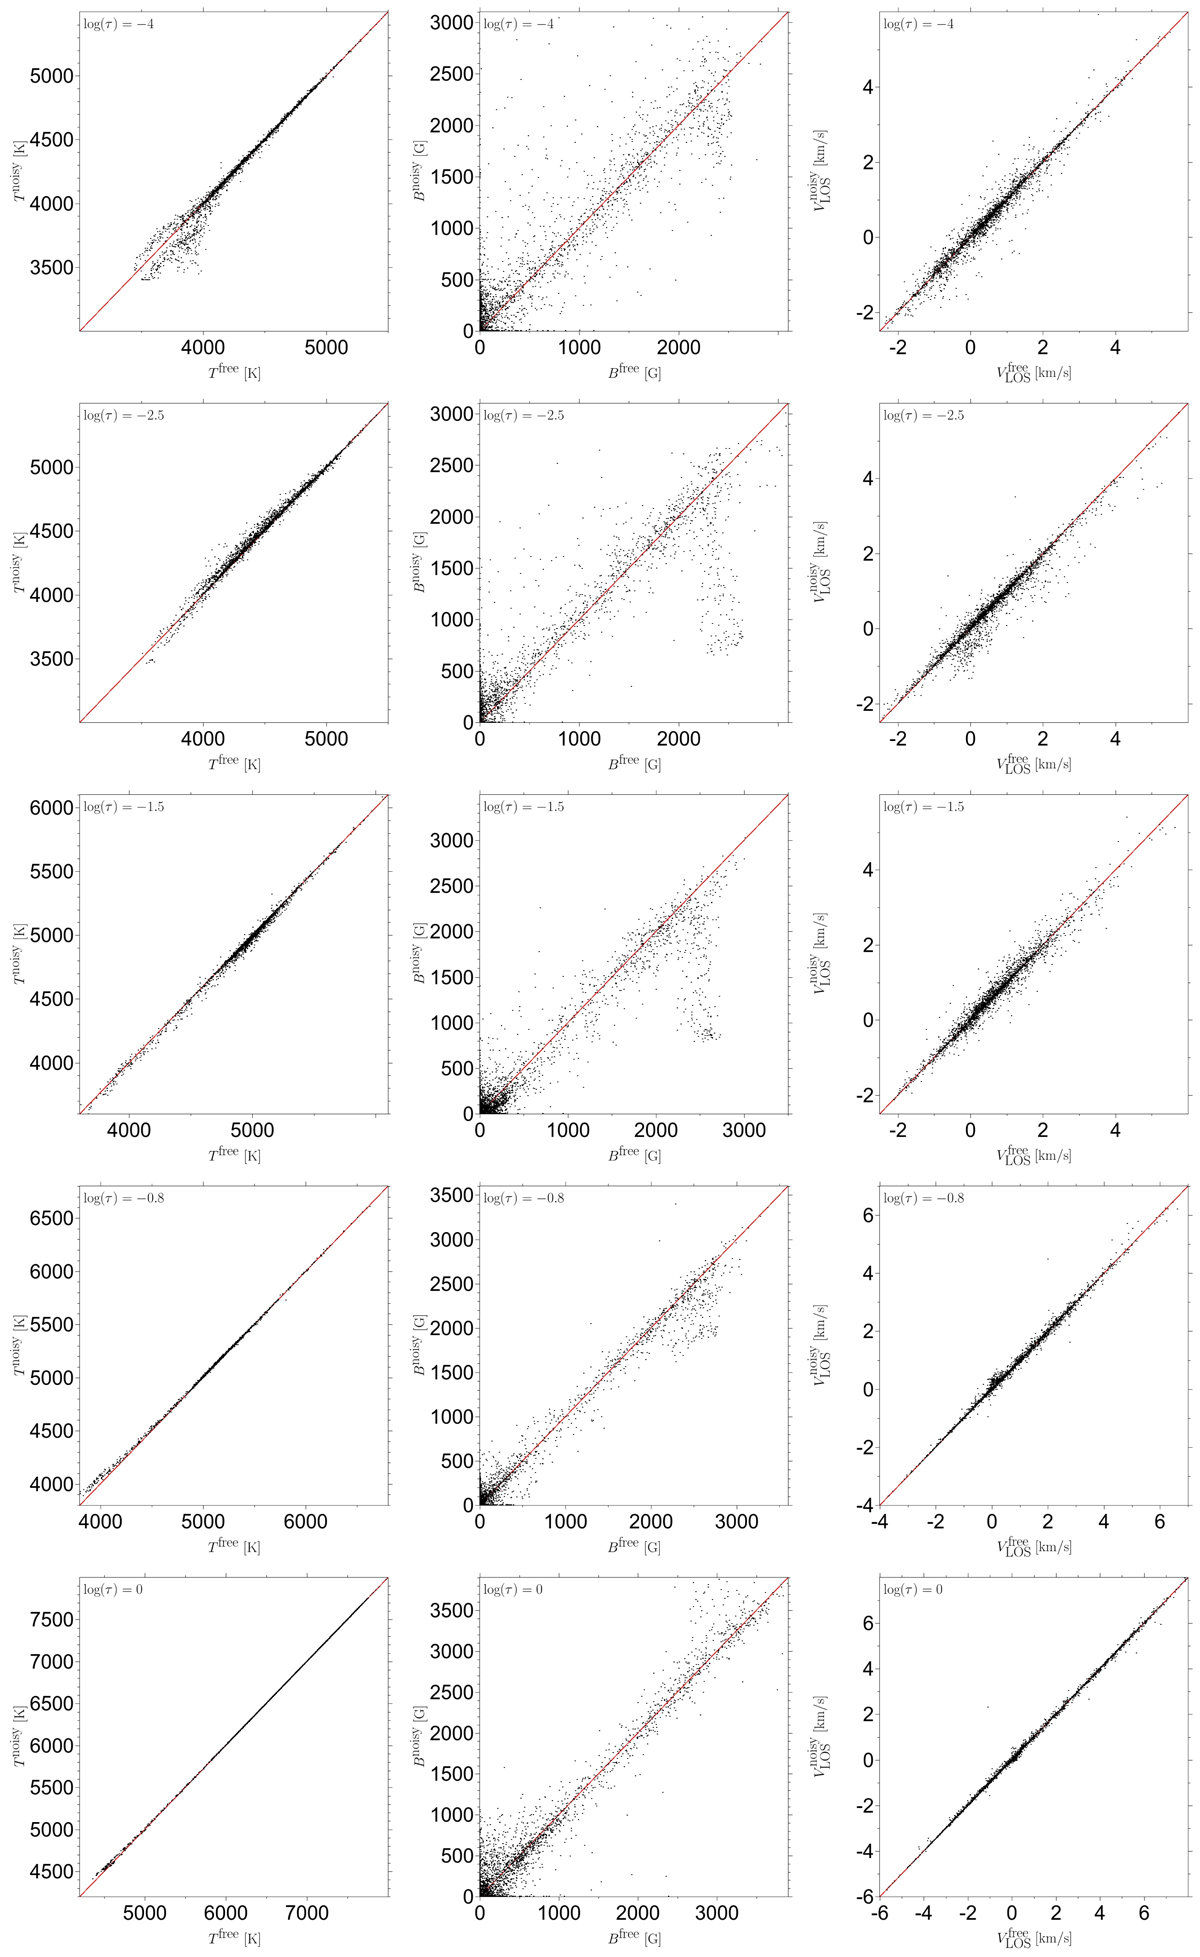
Scatter plots (black dots) of the temperature, magnetic field strength, and LOS velocity (from left to right) retrieved from an inversion of synthetic Stokes profiles degraded with realistic photon noise versus the inversion results from noise-free profiles at the optical depth nodes used during the inversion for the spectral region 3128.5 Å−3150 Å that contains 371 relevant spectral lines. The ideal relation for a perfect fit is indicated by the red line. From top to bottom the panels refer to different optical depth nodes (marked in the figures).
Current usage metrics show cumulative count of Article Views (full-text article views including HTML views, PDF and ePub downloads, according to the available data) and Abstracts Views on Vision4Press platform.
Data correspond to usage on the plateform after 2015. The current usage metrics is available 48-96 hours after online publication and is updated daily on week days.
Initial download of the metrics may take a while.