Fig. 12.
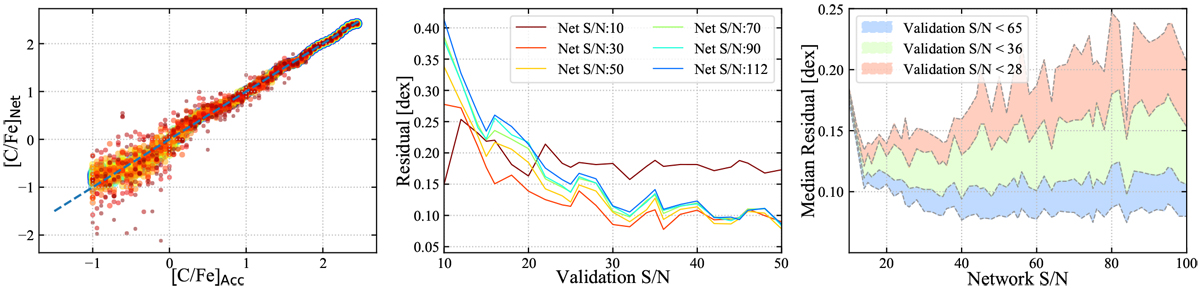
Results of synthetic carbon training for various S/N implementations. Left panel: [C/Fe] estimates from the network trained on S∕N = 122 inputs; the color of the estimates are proportional to the S/N of the validation photometry, where red indicates lower S/N. Middle panel: [C/Fe] residuals for networks of various S/N are shown, as a function of the S/N for the validation sets employed. Right panel: median residuals for three tiers of validation sets, S∕N < 28, S∕N < 36, and S∕N < 65, are shown, as a function of the network S/N.
Current usage metrics show cumulative count of Article Views (full-text article views including HTML views, PDF and ePub downloads, according to the available data) and Abstracts Views on Vision4Press platform.
Data correspond to usage on the plateform after 2015. The current usage metrics is available 48-96 hours after online publication and is updated daily on week days.
Initial download of the metrics may take a while.