Fig. 22.
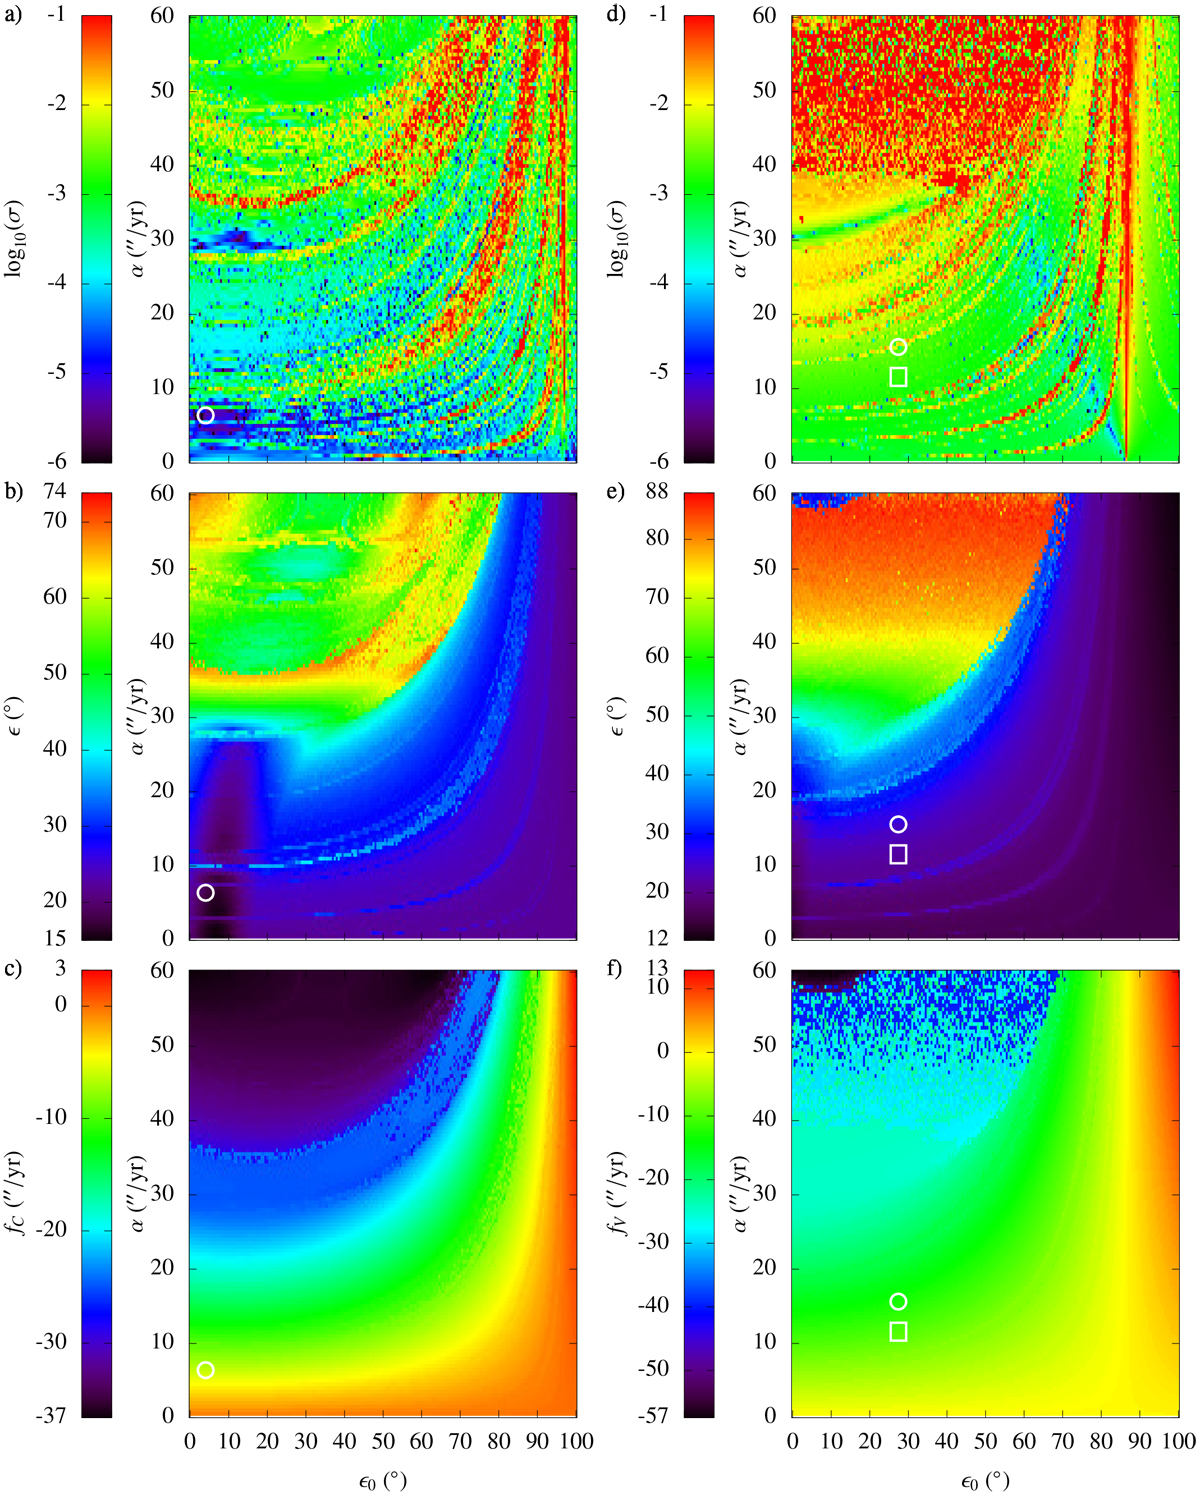
Stability of the rotation axis (panels a and d), amplitude of the obliquity on [−40 : 0] Myr (panels b and e), precession frequency on [−20 : 0] Myr (panels c and f), respectively, for Ceres and Vesta with respect to the initial obliquity and the precession constant for a grid of 24120 points. The white circles represent Ceres and Vesta for the epoch J2000. The color scale of the diffusion is represented on [−6 : −1], although log10 (σ) takes values outside this interval. Panels a and d: red points correspond to log10 (σ) ≥ −1 and black points to log10(σ) ≤ −6. Panels d–f: white squares represent Vesta before the two giant impacts.
Current usage metrics show cumulative count of Article Views (full-text article views including HTML views, PDF and ePub downloads, according to the available data) and Abstracts Views on Vision4Press platform.
Data correspond to usage on the plateform after 2015. The current usage metrics is available 48-96 hours after online publication and is updated daily on week days.
Initial download of the metrics may take a while.