Fig. 21.
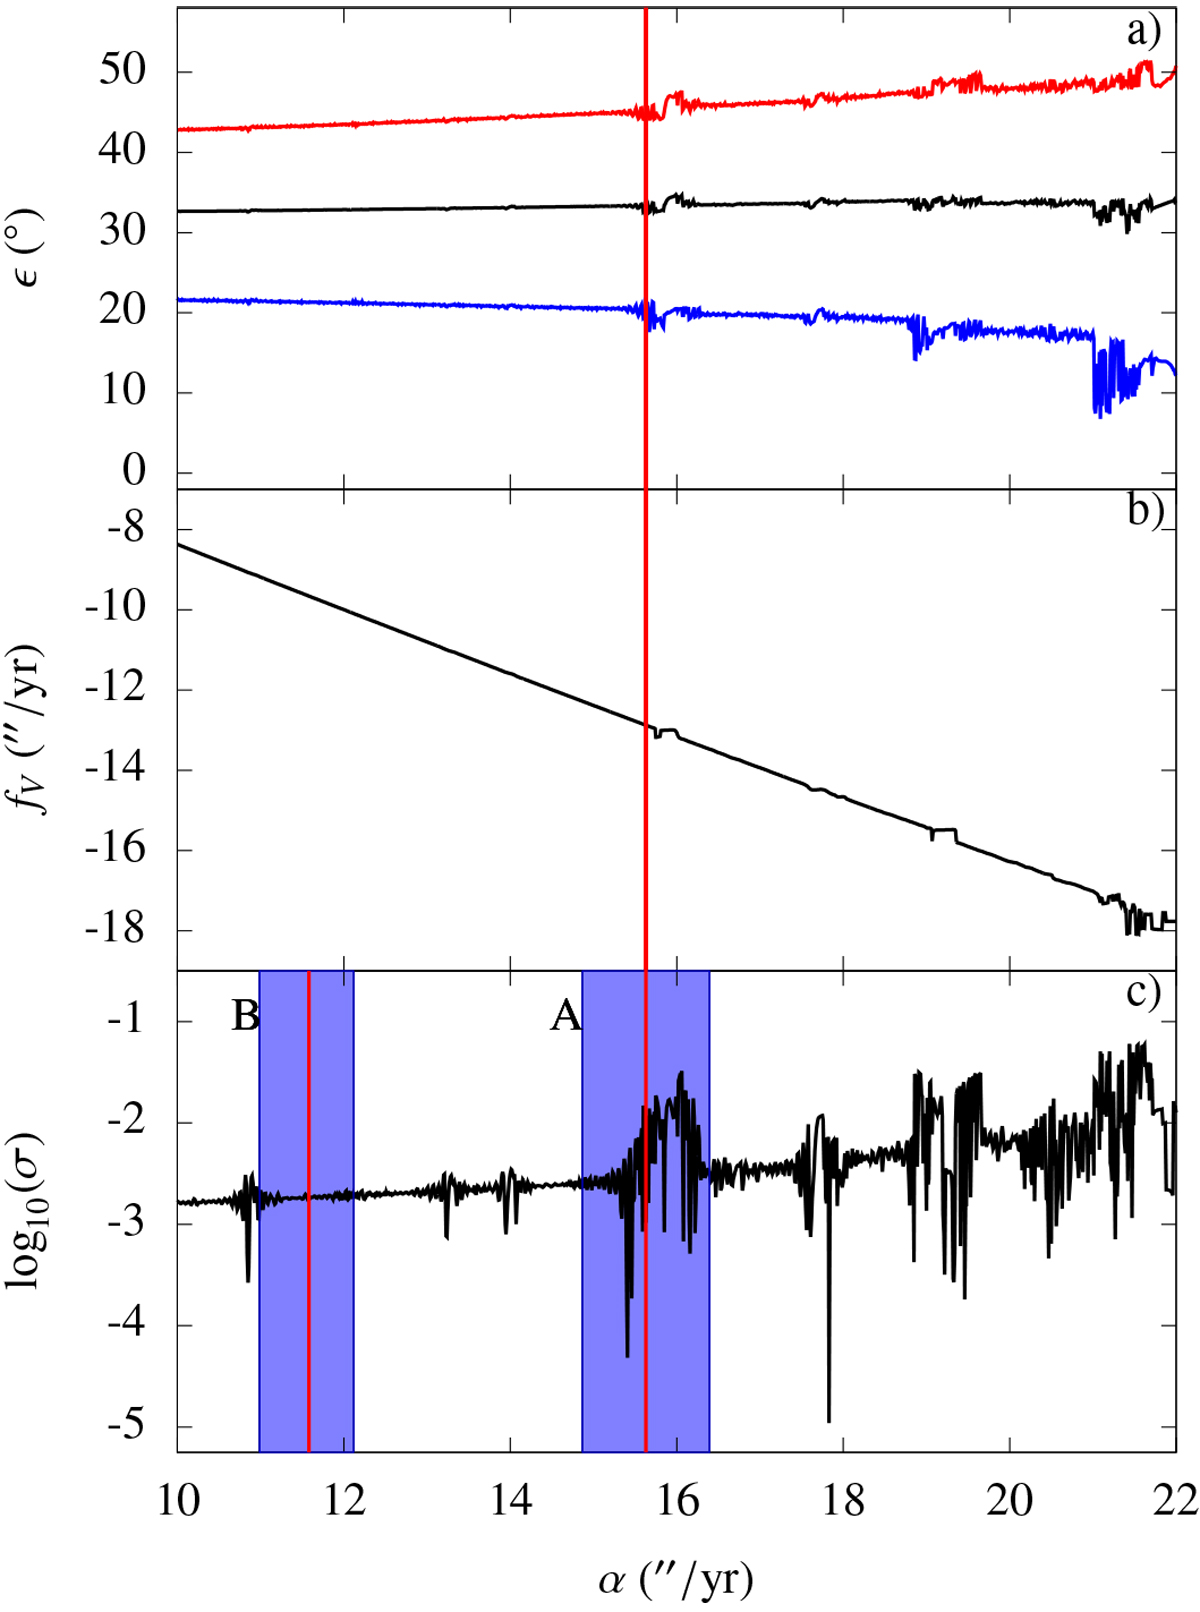
Obliquity (panel a), precession frequency (panel b), and diffusion of the precession frequency (panel c) for Vesta on [−40 : 0] Myr with respect to the precession constant. In panel a the maximum, mean, and minimum obliquities are, respectively, in red, black, and blue. In panel c the rectangle A represents the precession constants for ![]() with a vertical red line for
with a vertical red line for ![]() and B the same but before the two giant impacts.
and B the same but before the two giant impacts.
Current usage metrics show cumulative count of Article Views (full-text article views including HTML views, PDF and ePub downloads, according to the available data) and Abstracts Views on Vision4Press platform.
Data correspond to usage on the plateform after 2015. The current usage metrics is available 48-96 hours after online publication and is updated daily on week days.
Initial download of the metrics may take a while.