Fig. 9
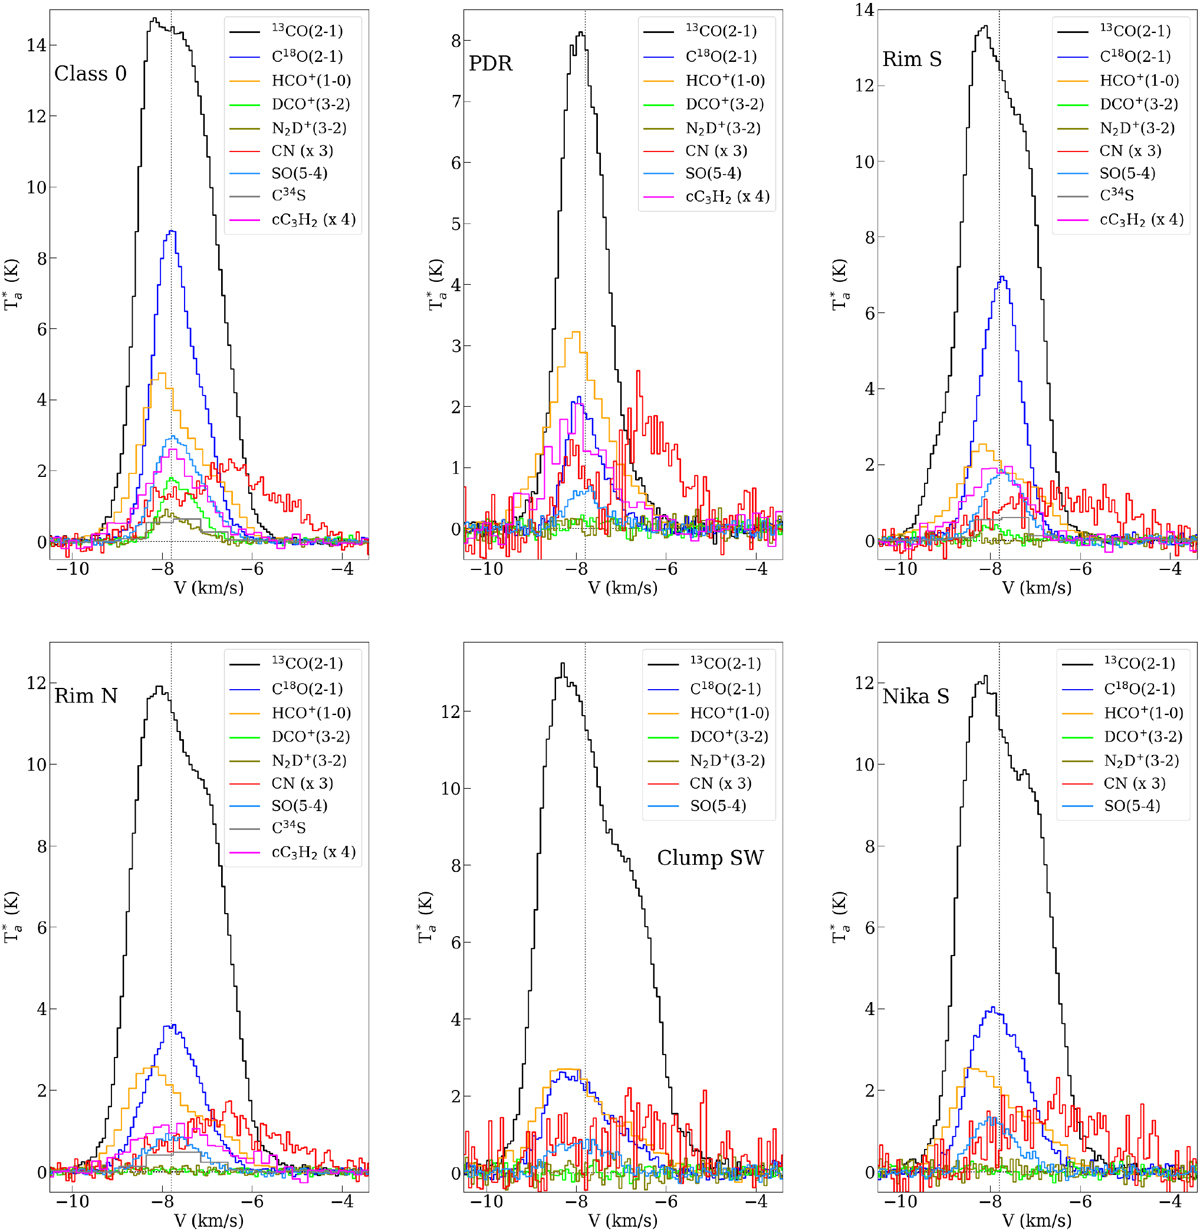
Average emission lines detected toward the various regions delineated in Fig. 8. The line profiles and strength between the Class 0 core and the rest of the regions are significantly different. The Rim S region also appears to be denserthan the rest, although it is clearly less dense than observed toward the Class 0 source. High-density tracers (N2 H+ and DCO+) are only observed toward the densest regions. The CN line (which is presented here multiplied by a factor of 3 because it is relatively weak) is strongly associated with the edges of the cloud, as expected if it is dominated by the photoevaporating cloud interface.
Current usage metrics show cumulative count of Article Views (full-text article views including HTML views, PDF and ePub downloads, according to the available data) and Abstracts Views on Vision4Press platform.
Data correspond to usage on the plateform after 2015. The current usage metrics is available 48-96 hours after online publication and is updated daily on week days.
Initial download of the metrics may take a while.