Fig. 8
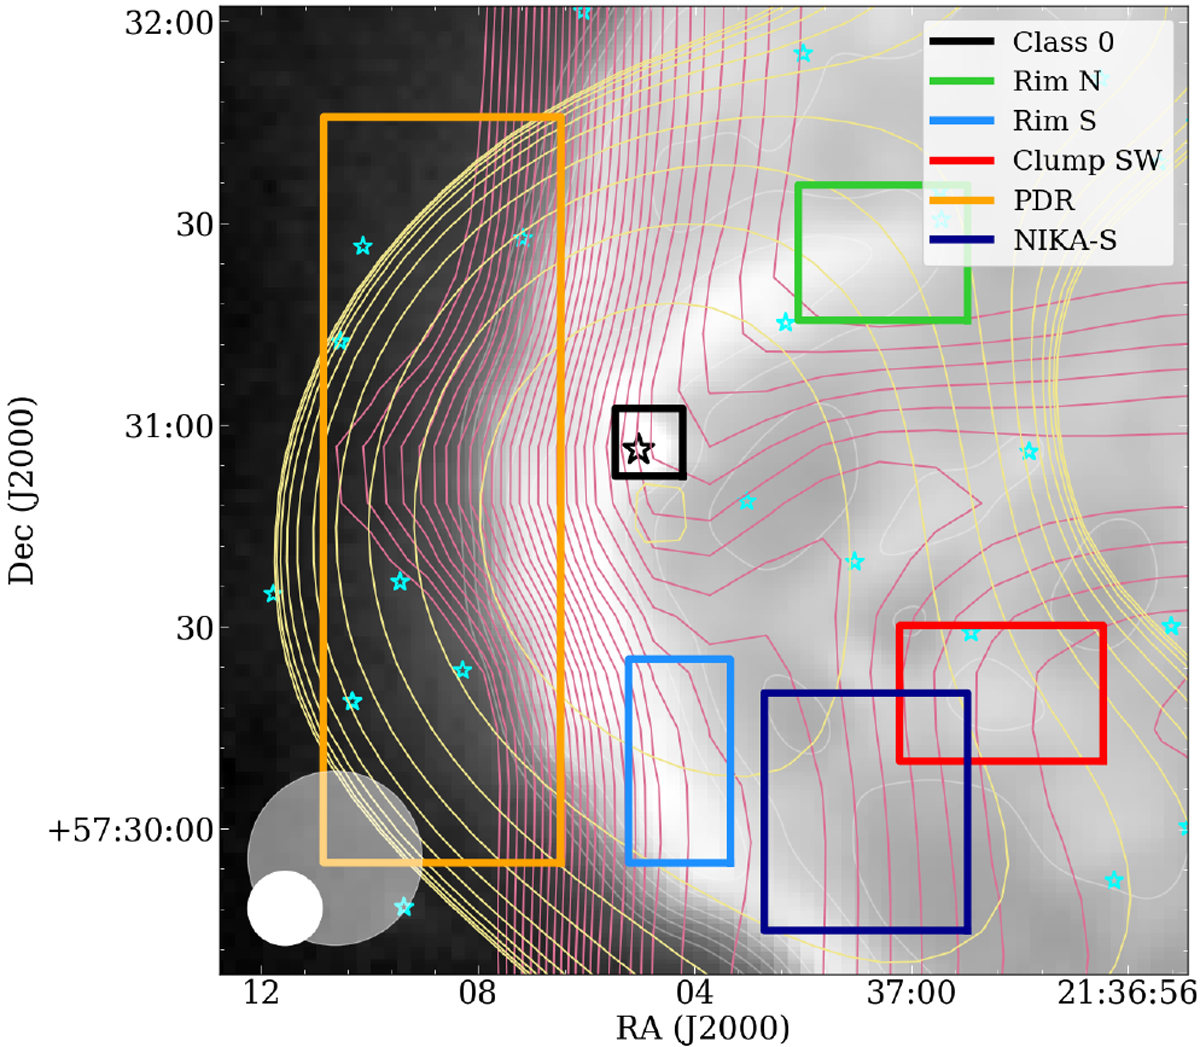
Selected areas in IC 1396A marked by colored boxes. The background gray image with white contours is the Herschel/PACS 70 μm map. The yellow contours show the NIKA 1.3 mm emission as in Fig. 1. The violet contours display the 13CO emission (23 linear contours in the range 8–30 K (T![]() ) km s−1). The Class 0object is marked with a large black star, the rest of the cluster members are shown with small cyan stars. The beams for the two frequency settings are also displayed.
) km s−1). The Class 0object is marked with a large black star, the rest of the cluster members are shown with small cyan stars. The beams for the two frequency settings are also displayed.
Current usage metrics show cumulative count of Article Views (full-text article views including HTML views, PDF and ePub downloads, according to the available data) and Abstracts Views on Vision4Press platform.
Data correspond to usage on the plateform after 2015. The current usage metrics is available 48-96 hours after online publication and is updated daily on week days.
Initial download of the metrics may take a while.