Fig. 5
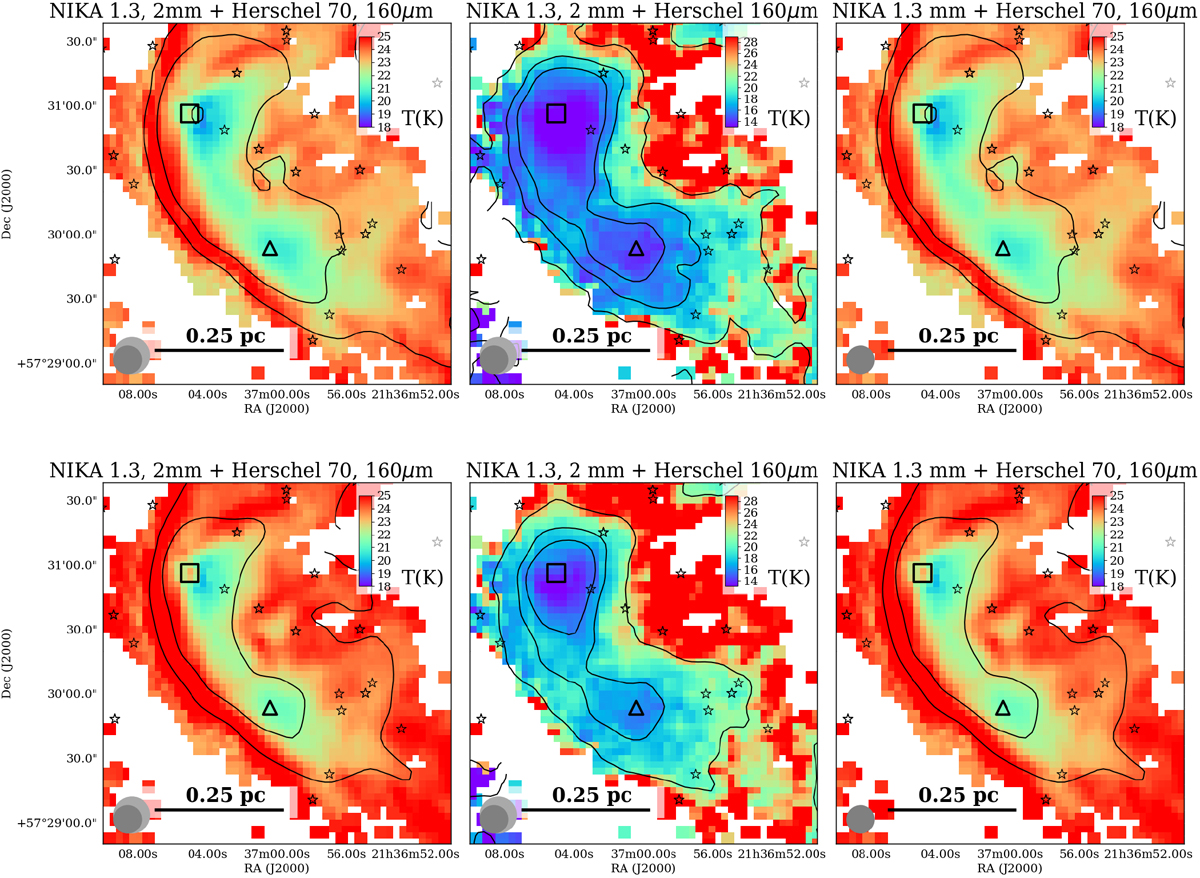
Temperature (color scale) and NH (contours) in the IC 1396A region, derived from all four datapoints (Herschel 70 and 160 μm and the NIKA data; left panels), the Herschel 160 μm and the NIKA data (middle panels), and the Herschel 70 and 160 μm and the NIKA 1.3 mm data (right panels), using a dust model with k70 = 118 cm2 g−1, β = 1.9 (top panels), and k70 = 118 cm2 g−1, β = 1.7 (bottom panels). The 70 μm position of the Class 0 source is marked with a black square, and NIKA S is marked with a triangle. The beams of the two NIKA bands are shown, together with a size indicator. The temperature scales are adapted in each case to show the full range of temperatures with as much detail as possible. Note that there are some biases toward lower or higher temperatures depending on the wavelengths used, as described in the text; relative values are more accurate. The long-wavelength fit is better at determining the global cloud temperature and structure, while the result from the inclusion of the 70 μm temperature is biased toward point-like stellar contributions especially near intermediate-mass protostars such as the objects north of V 390 Cep and the protostar α. The temperature and column density are derived only in the pixels with emission higher than 3σ over the background at all wavelengths. The column density contours mark the 5e21,1e22,5e22,1e23 cm−2 levels, noting that the NIKA + Herschel 160 μm maps start at 1e22 only as they are noise-dominated below this threshold.
Current usage metrics show cumulative count of Article Views (full-text article views including HTML views, PDF and ePub downloads, according to the available data) and Abstracts Views on Vision4Press platform.
Data correspond to usage on the plateform after 2015. The current usage metrics is available 48-96 hours after online publication and is updated daily on week days.
Initial download of the metrics may take a while.