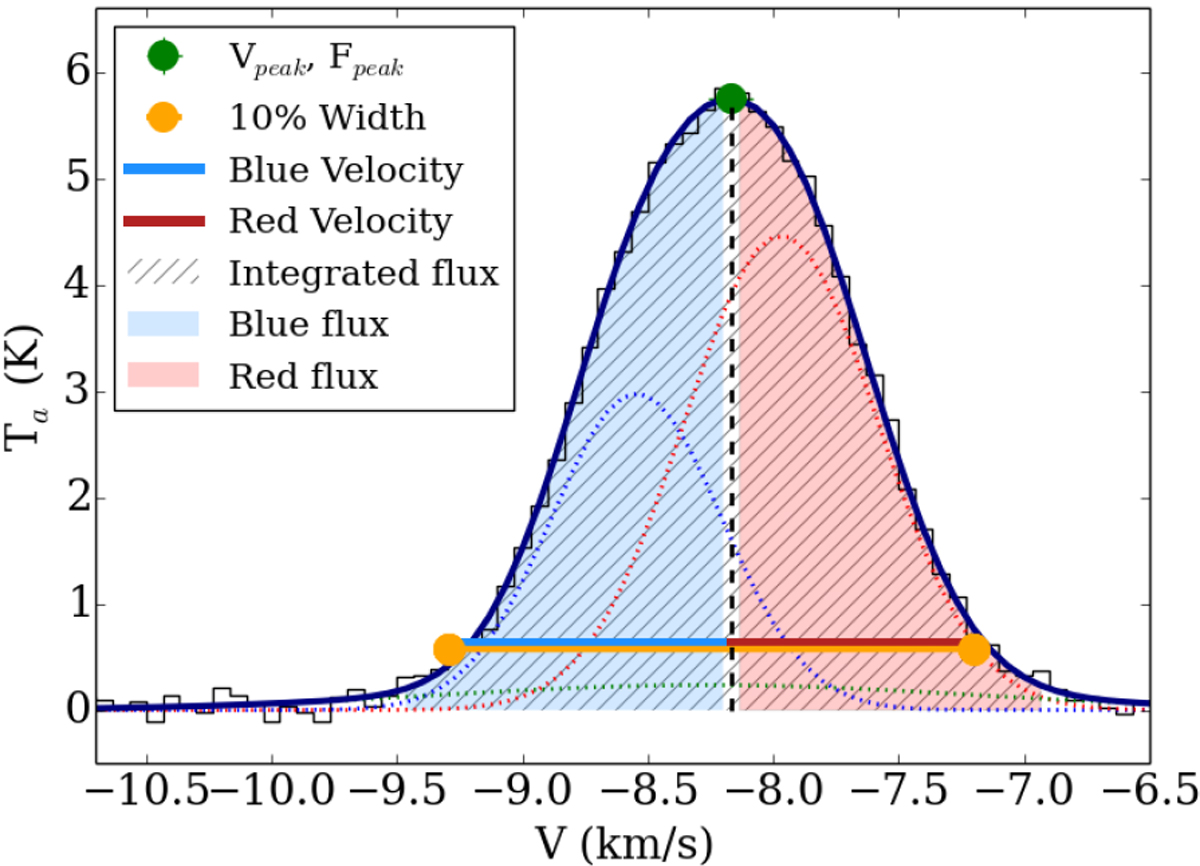
Fig. C.1

Line parameters derived from the line fit (dark blue line) for a C18O line, with the data shown as the black step-plot. The peak velocity and flux (Vpeak, Fpeak) are self-explanatory. The line width is measured at 10% of the peak height. The blue and red side of the velocity width are used to determine the blue and red velocity, and the corresponding velocity asymmetry as the ratio of the blue/red velocity. The integrated flux is measured starting at 3σ. The blue and red parts of the flux are ratioed to obtain the flux asymmetry. Although the underlying multi-Gaussian fit is highly degenerate (blue, green, and red dotted lines), the line parameters derived (integrated flux, peak velocity and flux, line width, velocity, and flux asymmetries) will be independent of the fit if the final fit reproduces the line adequately.
Current usage metrics show cumulative count of Article Views (full-text article views including HTML views, PDF and ePub downloads, according to the available data) and Abstracts Views on Vision4Press platform.
Data correspond to usage on the plateform after 2015. The current usage metrics is available 48-96 hours after online publication and is updated daily on week days.
Initial download of the metrics may take a while.


