Fig. B.1
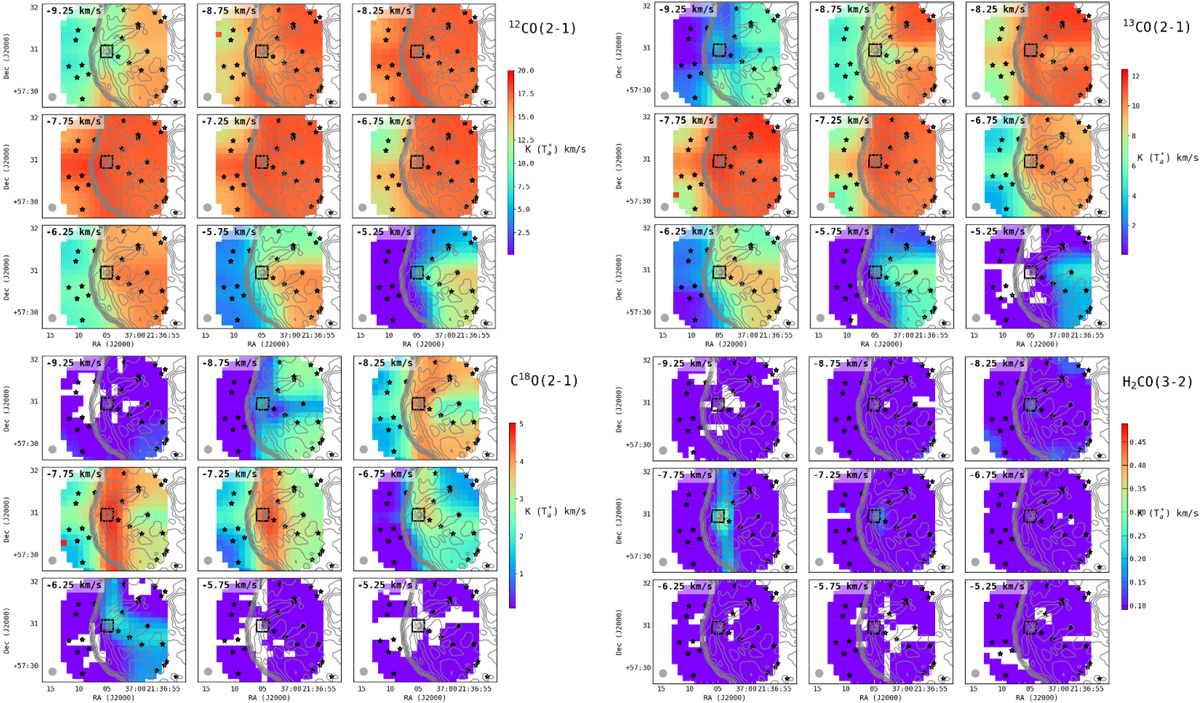
Velocity integrated bit maps. The colors show the line intensity integrated around 0.5 km s−1 per velocity bin between 3σ and the maximum. White is used when no line emission beyond 3σ is detected in the bin (the bottom of the color scale would usually correspond to the noise level). The velocity bins are much larger than the spectral resolution for the sake of space, as most of the lines are detected in between tens to over two hundred channels. The contours mark for reference the Herschel 70 μm emission on a log scale between 0.1 and 2 Jy beam−1. The beam size is shown for each line. Symbols: IC 1396A-PACS-1 (large black square), other YSO candidates (small black stars). From left to right, top to bottom panels: 12CO, 13CO, C18O, and H2CO.
Current usage metrics show cumulative count of Article Views (full-text article views including HTML views, PDF and ePub downloads, according to the available data) and Abstracts Views on Vision4Press platform.
Data correspond to usage on the plateform after 2015. The current usage metrics is available 48-96 hours after online publication and is updated daily on week days.
Initial download of the metrics may take a while.