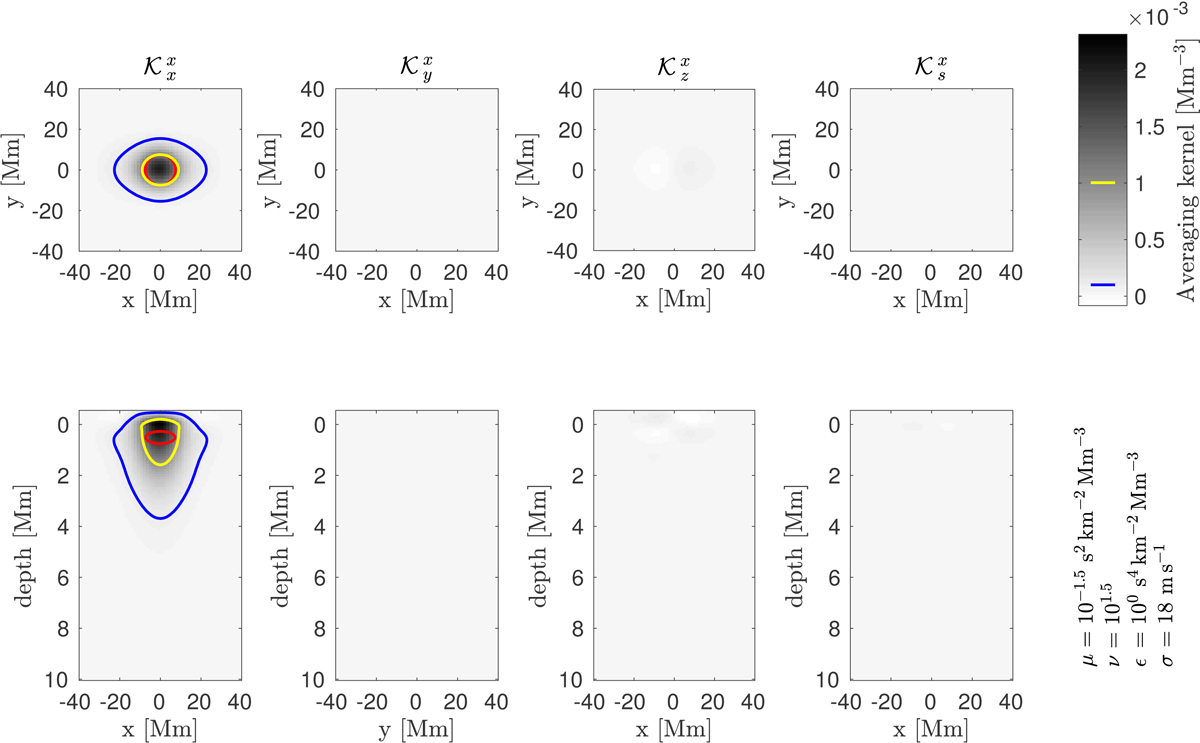
Fig. 2.

Averaging kernels for υx inversion at 0.5 Mm depth. The cross-talk was minimised. The red curve corresponds to the half-maximum of the GdG target function, the yellow curve corresponds to the half-maximum of the averaging kernel and the blue solid and blue dotted (not present in this figure) curves correspond to +5% and −5% of the maximum of the averaging kernel, respectively. In the top row there are horizontal slices of the averaging kernel at the target depth and in the bottom row there are vertical slices perpendicular to the symmetries. In the right part one can see the selection of the trade-off parameters and the standard deviation when assuming the travel times averaged over 24 hours.
Current usage metrics show cumulative count of Article Views (full-text article views including HTML views, PDF and ePub downloads, according to the available data) and Abstracts Views on Vision4Press platform.
Data correspond to usage on the plateform after 2015. The current usage metrics is available 48-96 hours after online publication and is updated daily on week days.
Initial download of the metrics may take a while.


