Free Access
Fig. 14.
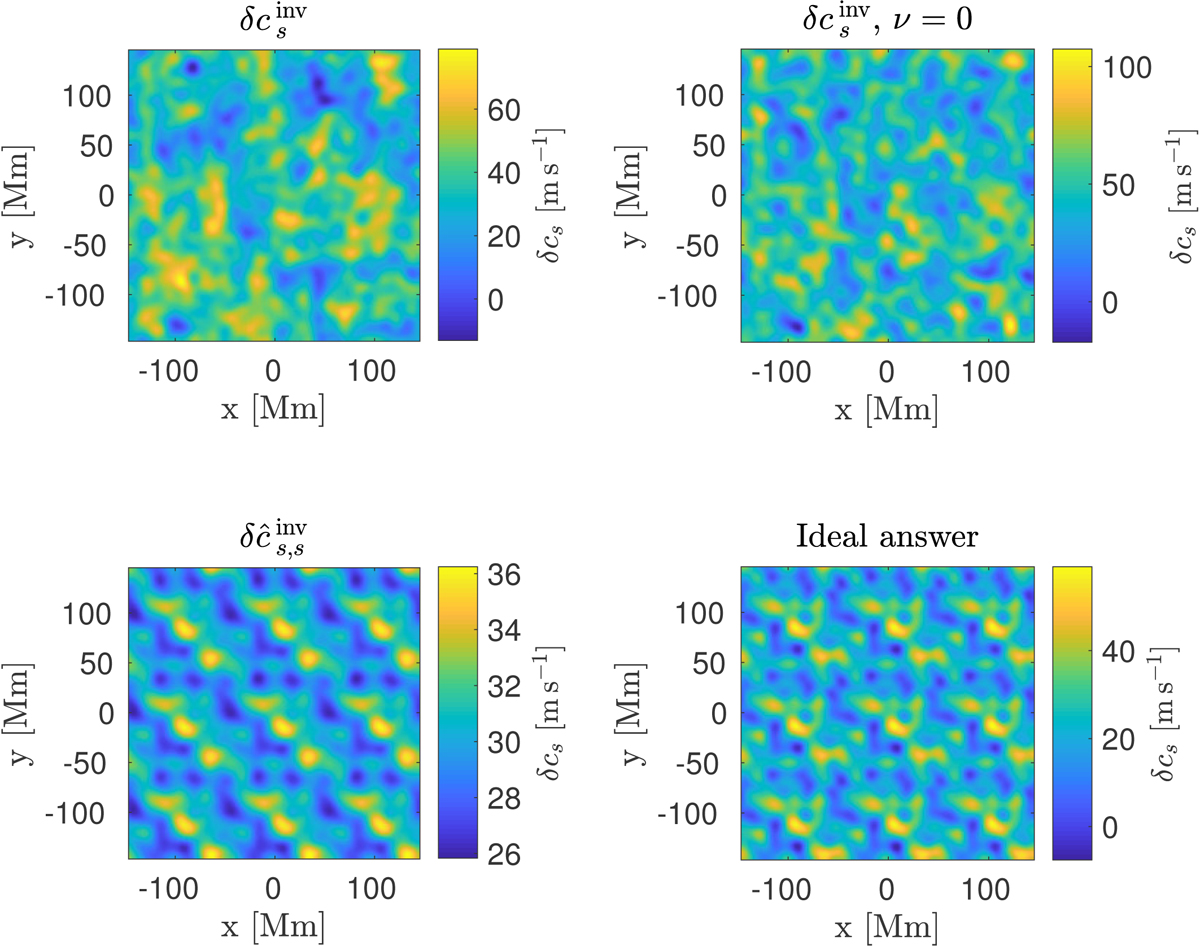
Top row: ![]() with minimisation of the cross-talk and
with minimisation of the cross-talk and ![]() without minimisation of the cross-talk. Bottom row:
without minimisation of the cross-talk. Bottom row: ![]() and ideal answer. The correlation coefficient between
and ideal answer. The correlation coefficient between ![]() and ideal answer is 0.90. The colour bars are not the same.
and ideal answer is 0.90. The colour bars are not the same.
Current usage metrics show cumulative count of Article Views (full-text article views including HTML views, PDF and ePub downloads, according to the available data) and Abstracts Views on Vision4Press platform.
Data correspond to usage on the plateform after 2015. The current usage metrics is available 48-96 hours after online publication and is updated daily on week days.
Initial download of the metrics may take a while.