Fig. 10.
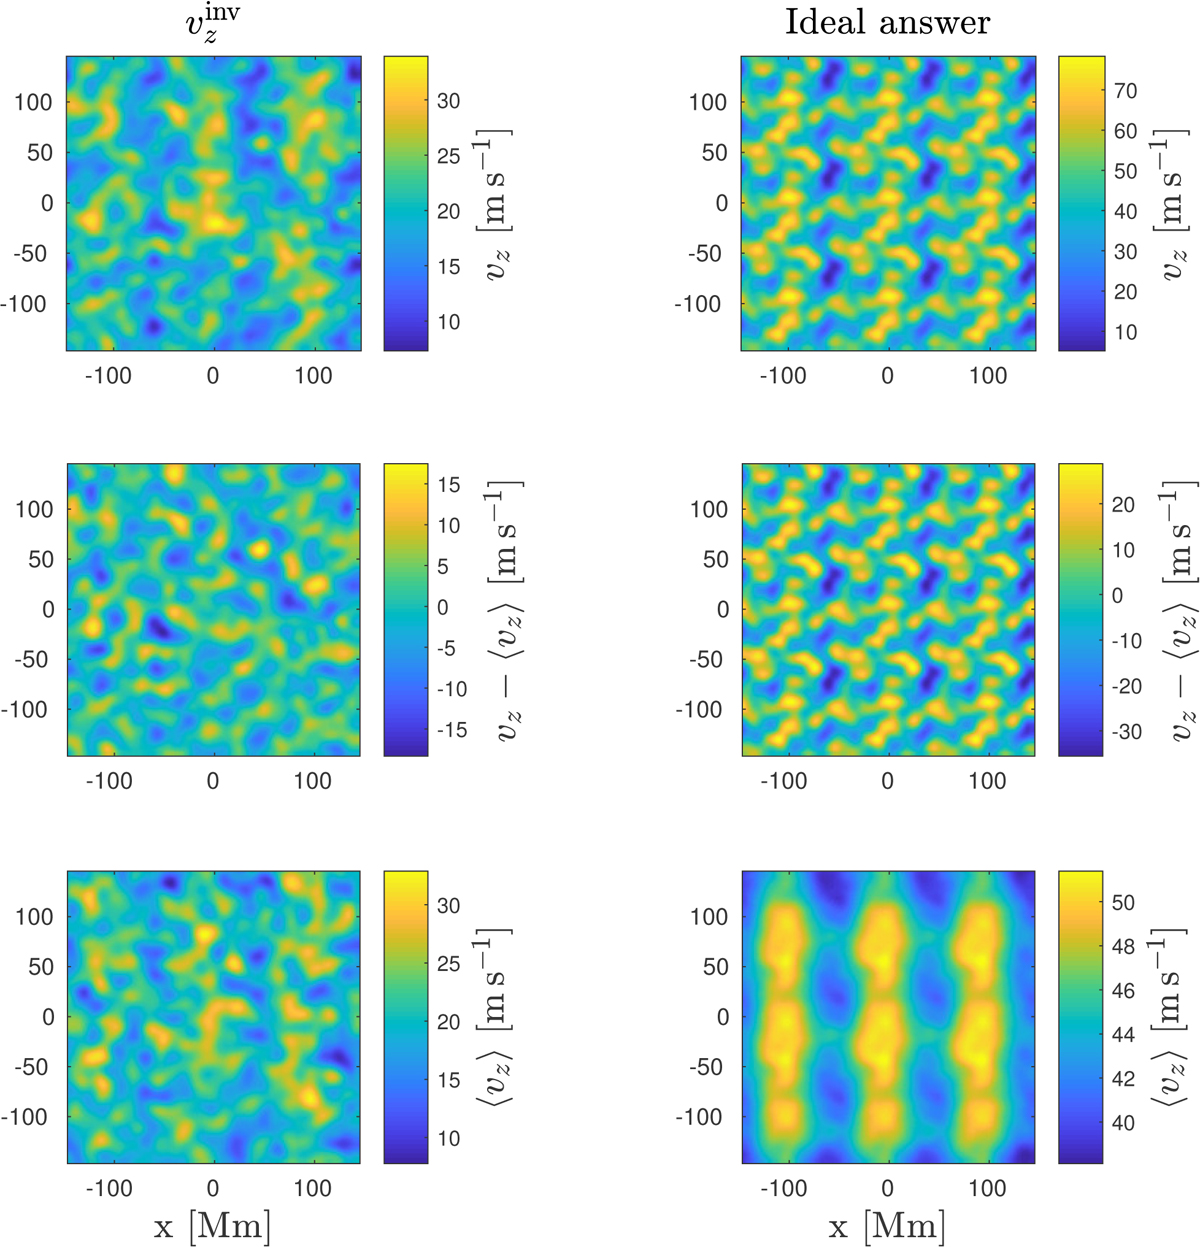
Top row: results of the inversion for υz with the mean and the difference geometries. Middle row: results of the inversion with the difference geometries only. Bottom row: difference of two aforementioned inversions. Left column: ![]() . Right column: ideal answers of the inversions. We point out that the colour bars are not scaled.
. Right column: ideal answers of the inversions. We point out that the colour bars are not scaled.
Current usage metrics show cumulative count of Article Views (full-text article views including HTML views, PDF and ePub downloads, according to the available data) and Abstracts Views on Vision4Press platform.
Data correspond to usage on the plateform after 2015. The current usage metrics is available 48-96 hours after online publication and is updated daily on week days.
Initial download of the metrics may take a while.