Free Access
Fig. 1.
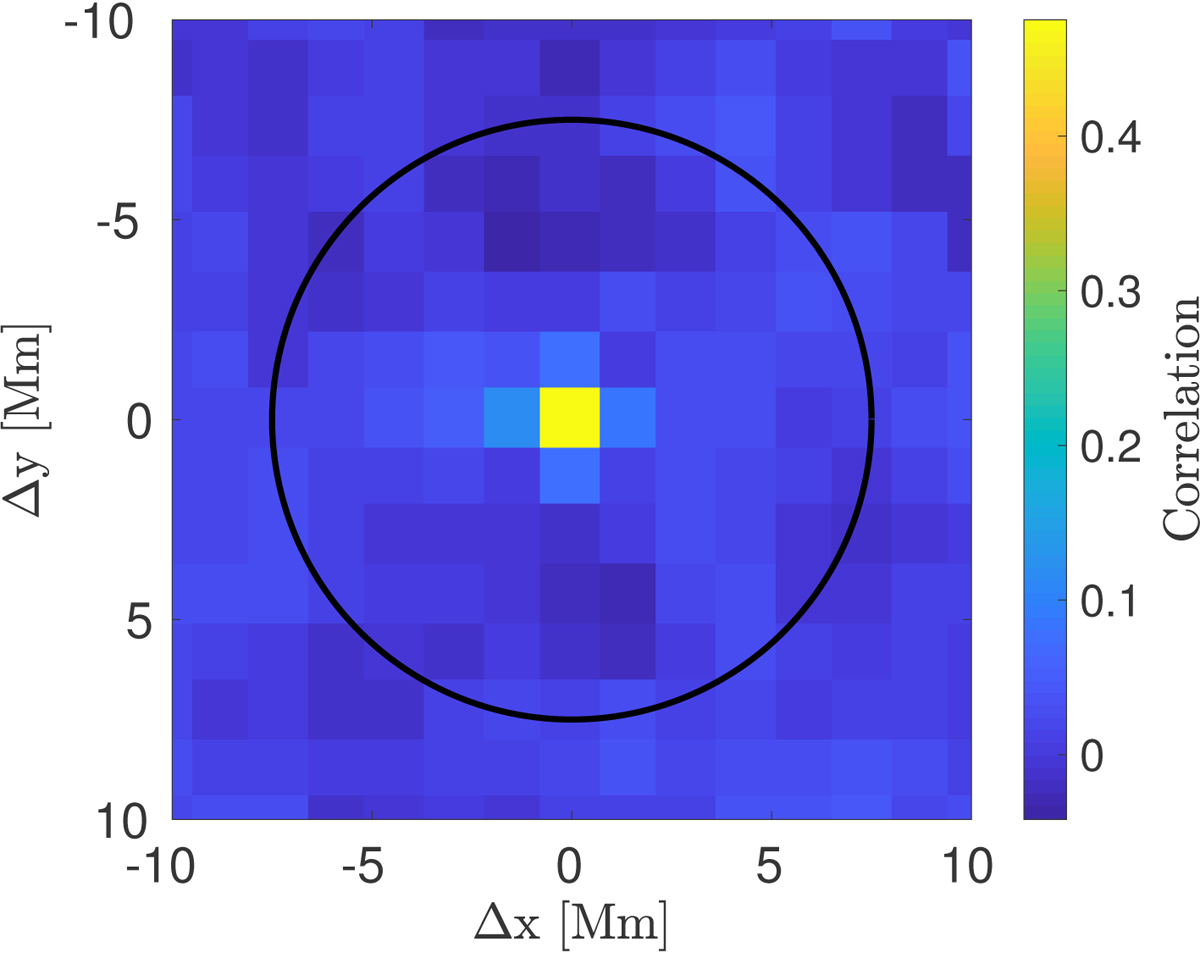
Map of correlation between the vertical velocity and the sound–speed perturbation in the near-surface layers obtained from the realistic simulation of the solar convection by Rempel (2014). This plot is analogous to Fig. 8 of Švanda et al. (2011). The black circle corresponds to the width of the target function (15 Mm).
Current usage metrics show cumulative count of Article Views (full-text article views including HTML views, PDF and ePub downloads, according to the available data) and Abstracts Views on Vision4Press platform.
Data correspond to usage on the plateform after 2015. The current usage metrics is available 48-96 hours after online publication and is updated daily on week days.
Initial download of the metrics may take a while.