Free Access
Fig. B.1.
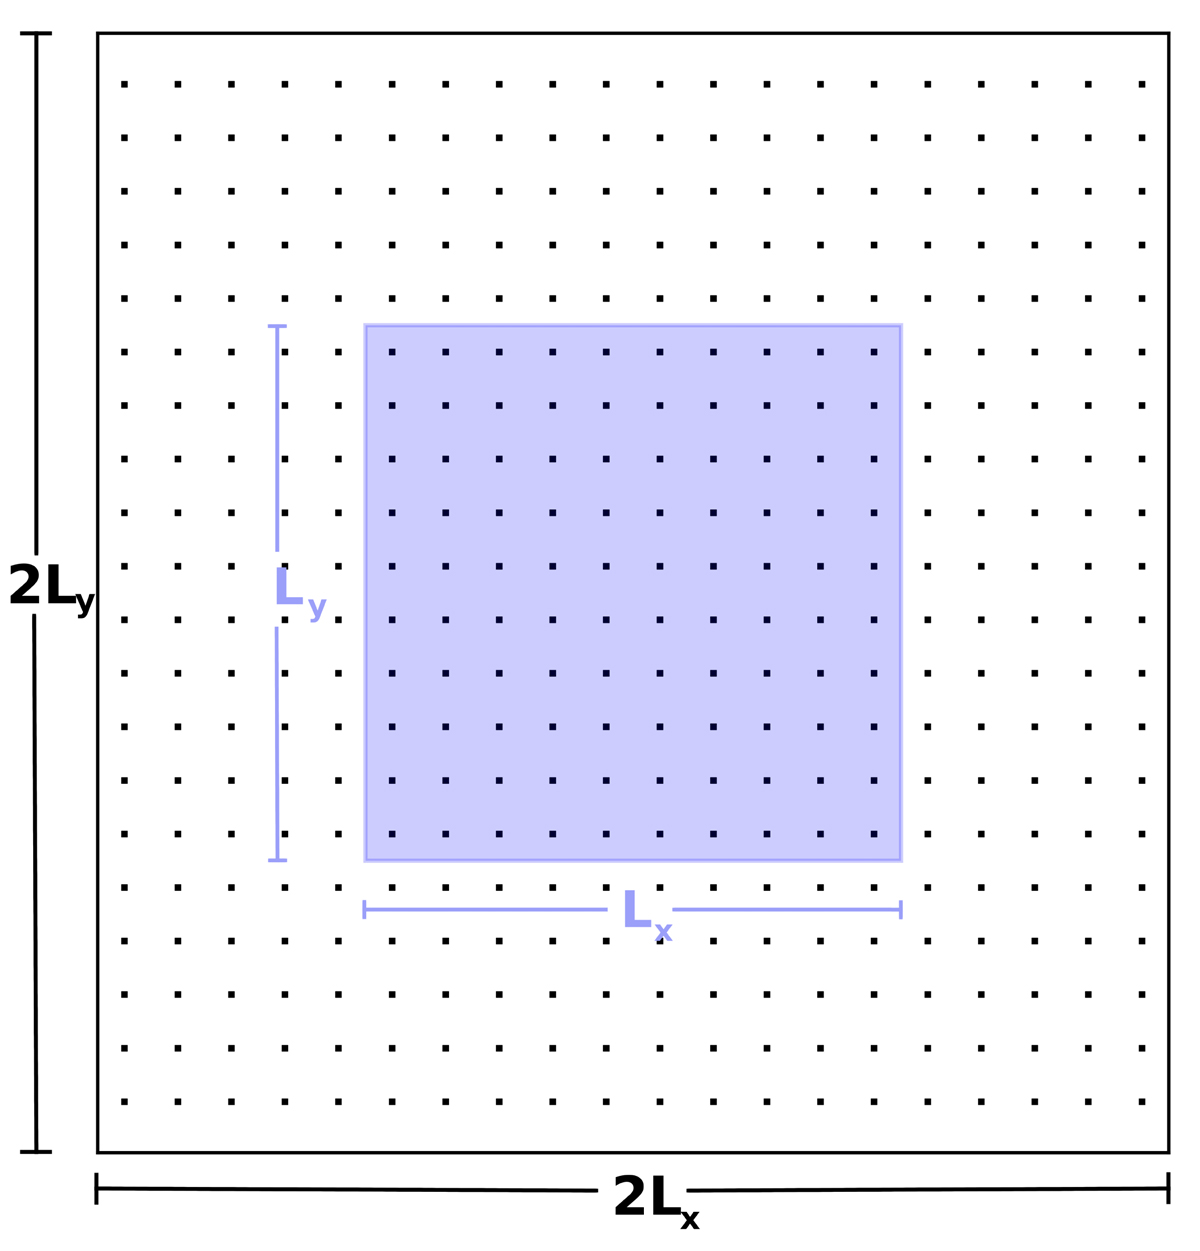
Dimensions of control distributions CDA (blue shaded) and CDB (all visible) as described in Appendix B, where Lx and Ly are the length of a test sample’s x and y axis respectively; and the black dots are the points of the control distributions.
Current usage metrics show cumulative count of Article Views (full-text article views including HTML views, PDF and ePub downloads, according to the available data) and Abstracts Views on Vision4Press platform.
Data correspond to usage on the plateform after 2015. The current usage metrics is available 48-96 hours after online publication and is updated daily on week days.
Initial download of the metrics may take a while.