Fig. 5.
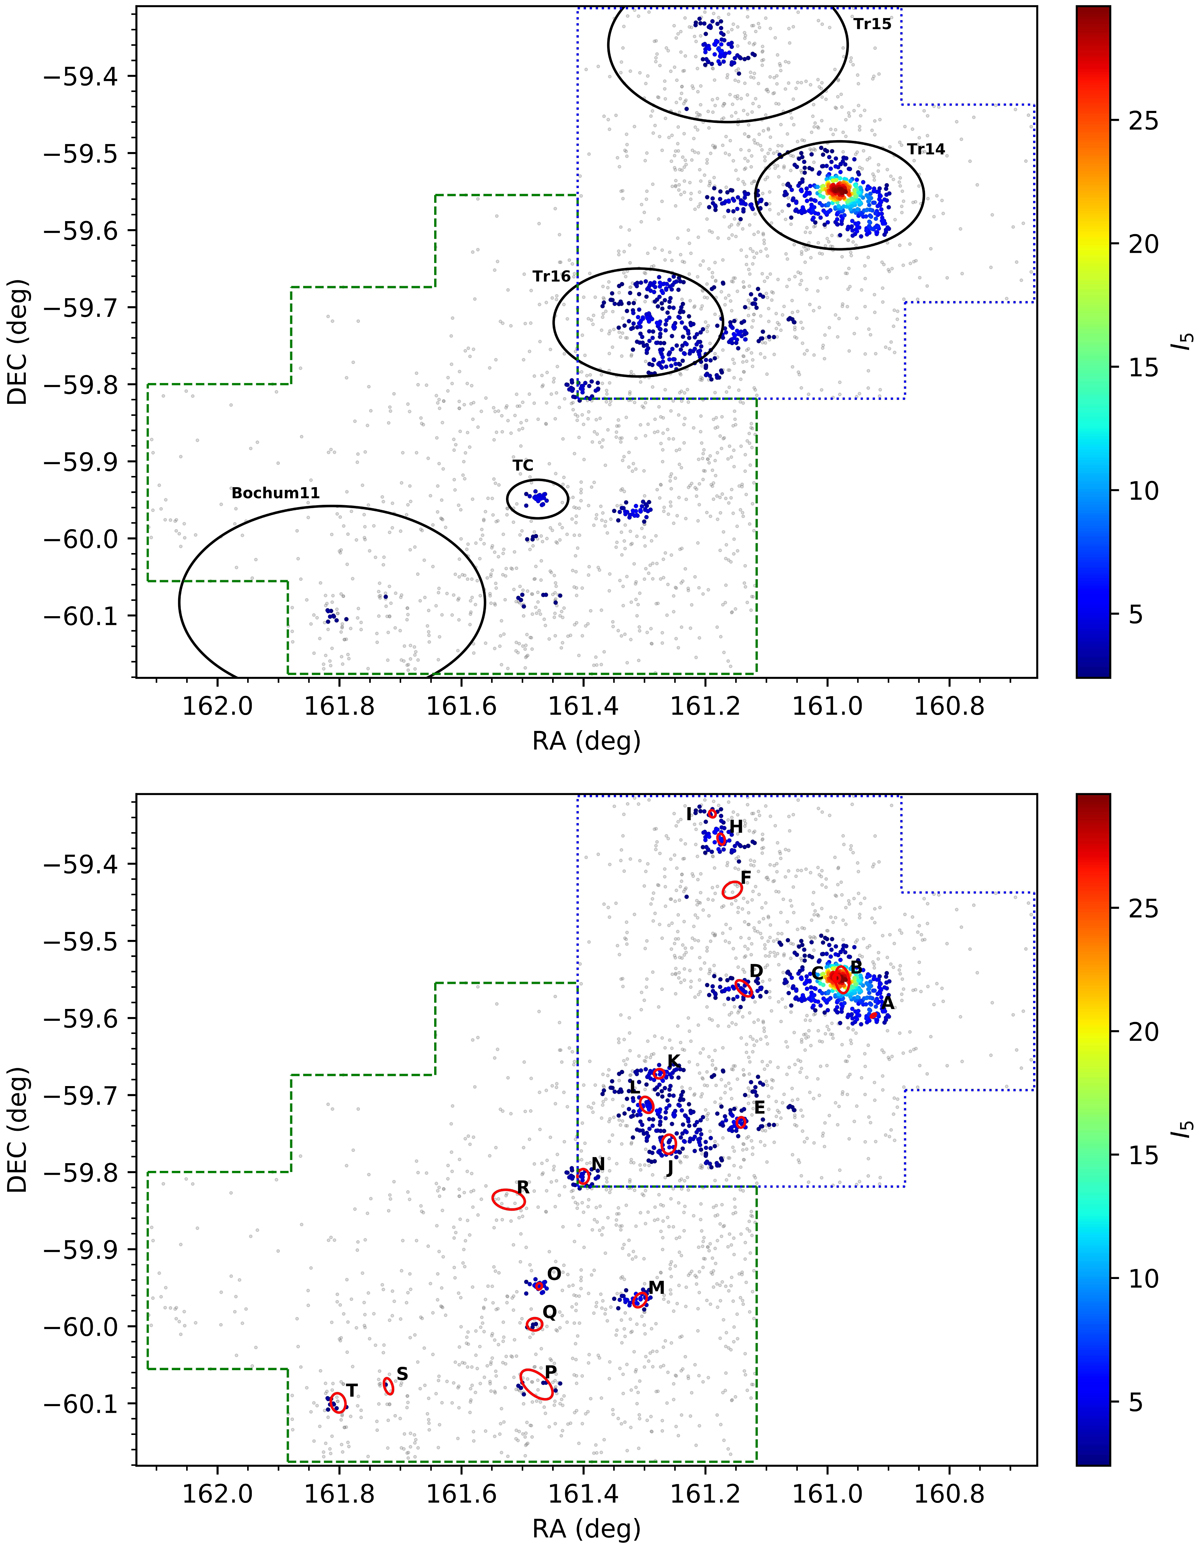
Index values, I5, calculated by INDICATE for the Carina region with positions of the Tr14, Tr15, Tr16, TC and Bochum 11 clusters overlaid as black ellipses (top panel) and 19 sub-clusters identified by Kuhn et al. (2014) overlaid as red ellipses (bottom panel; see text for details). The borders of our designated NW and SE regions are marked with blue dotted and green dashed lines respectively. Stars with an index value above the significance threshold (I5 > 2.3) coloured as described by the colour bar. Grey dots are stars with I5 < 2.3.
Current usage metrics show cumulative count of Article Views (full-text article views including HTML views, PDF and ePub downloads, according to the available data) and Abstracts Views on Vision4Press platform.
Data correspond to usage on the plateform after 2015. The current usage metrics is available 48-96 hours after online publication and is updated daily on week days.
Initial download of the metrics may take a while.