Fig. A.1.
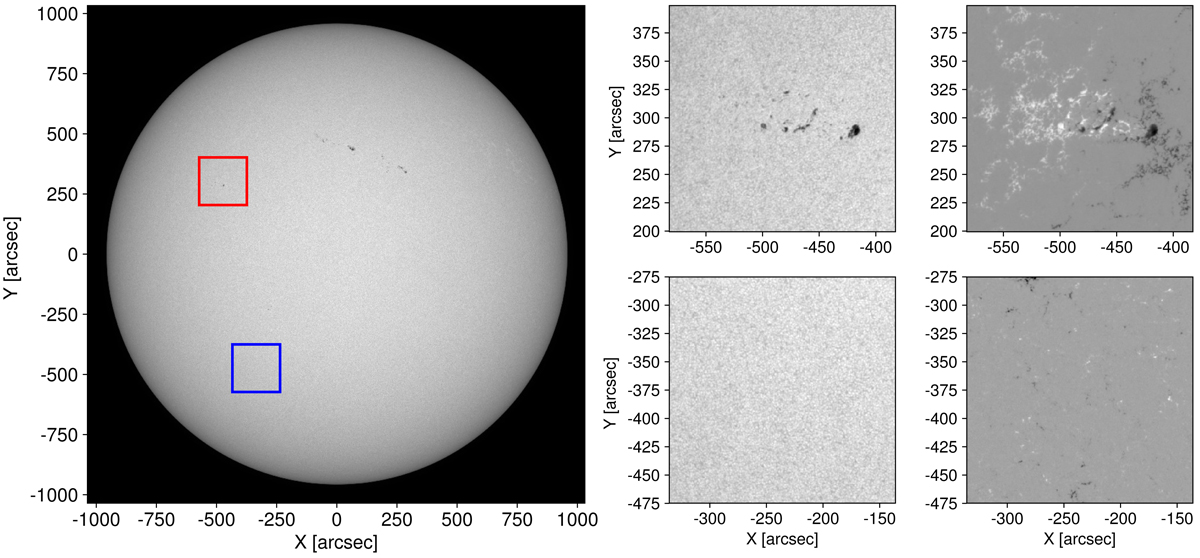
Overview of the analysed regions. Left panel: full disc Sun as seen by SDO/HMI on the day of observations. The two regions of interest are marked by a red square – active region NOAA 11190 – and blue square – quiet Sun region. Right panel, top row from left to right: a continuum map of the NOAA 11190 (red square) followed by the corresponding magnetogram is shown. Bottom row: same, but for the quiet Sun region. Time shown is April, 11 2011 at 17:45 UT.
Current usage metrics show cumulative count of Article Views (full-text article views including HTML views, PDF and ePub downloads, according to the available data) and Abstracts Views on Vision4Press platform.
Data correspond to usage on the plateform after 2015. The current usage metrics is available 48-96 hours after online publication and is updated daily on week days.
Initial download of the metrics may take a while.