Fig. 7.
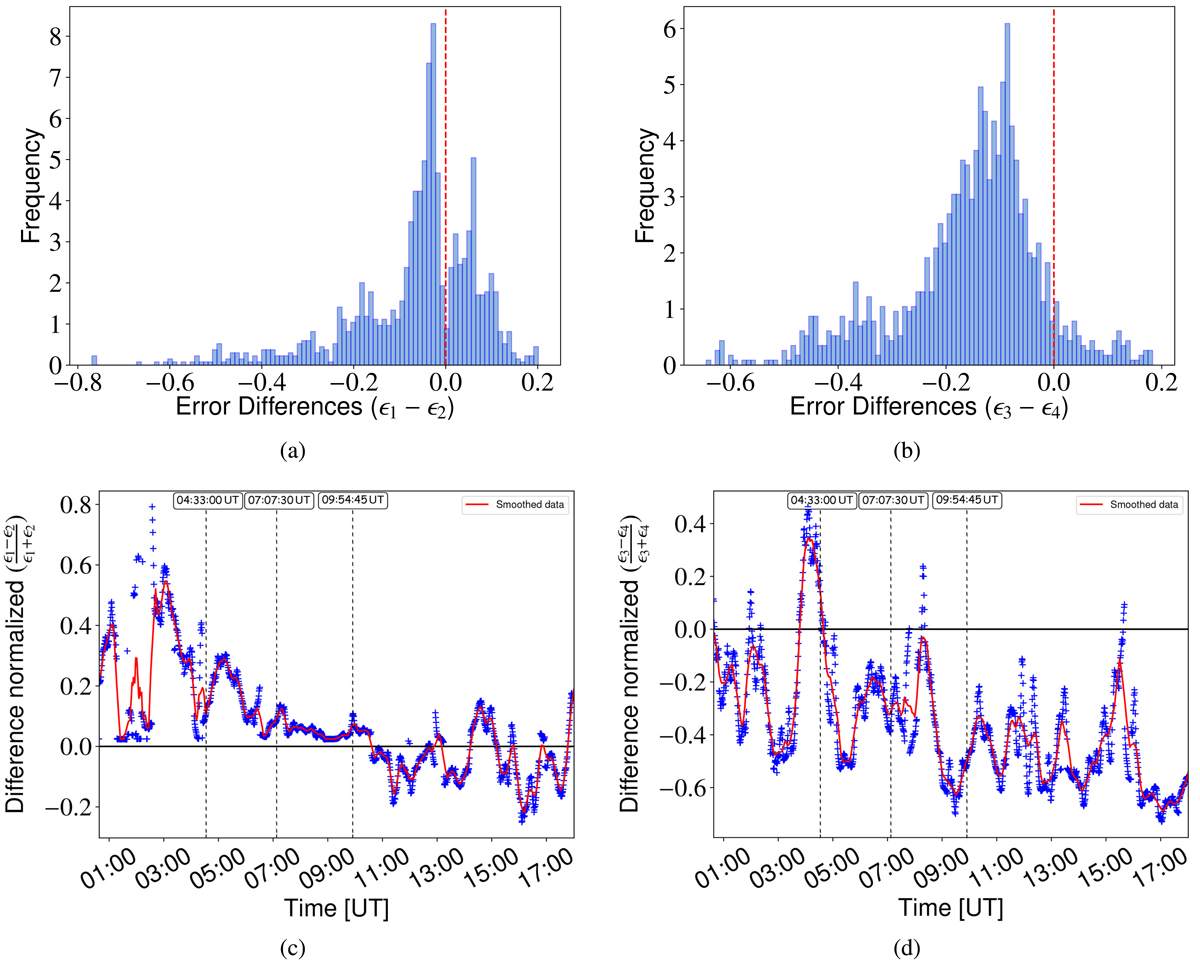
Normalized reduced χ2 value (ϵx) was calculated for the two fitting combinations to decide the goodness of a fit, that is, which combination of functions would fit the flow maps better. Panels a and b: distribution for the difference between ϵ1 and ϵ2, for the distributions obtained from the LOS magnetograms, as well as for the difference between ϵ3 and ϵ4, for the distributions obtained from the continuum maps. Normalized reduced chi squared values ϵ1 and ϵ3 are related to Eq. (4), whereas ϵ2 and ϵ4 are related to Eq. (5). Panels c and d: temporal evolution of the changes of these differences between corresponding ϵ.
Current usage metrics show cumulative count of Article Views (full-text article views including HTML views, PDF and ePub downloads, according to the available data) and Abstracts Views on Vision4Press platform.
Data correspond to usage on the plateform after 2015. The current usage metrics is available 48-96 hours after online publication and is updated daily on week days.
Initial download of the metrics may take a while.