Fig. 6.
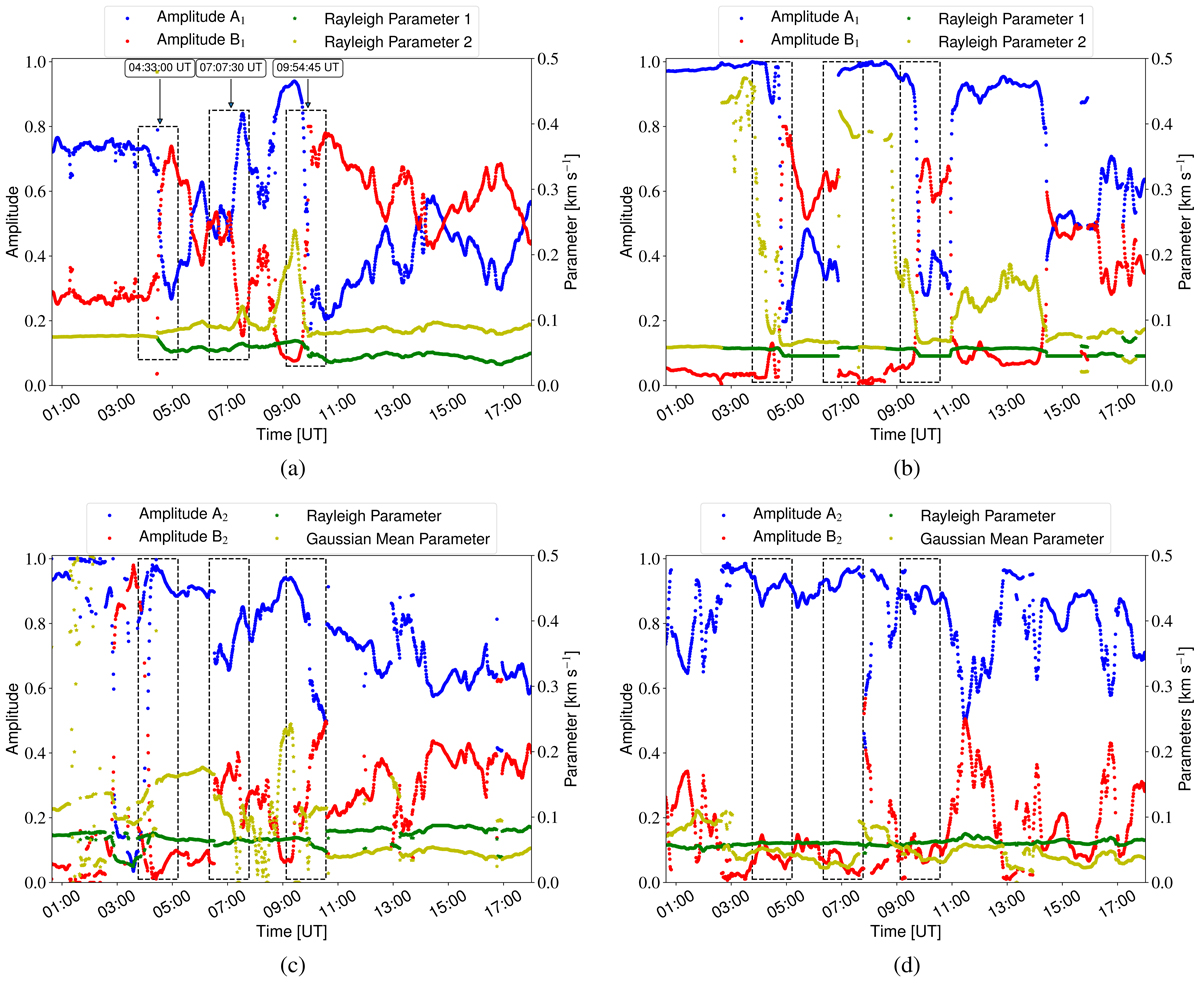
Temporal evolution of the parameters associated with the proposed distributions in Eqs. (4) and (5). First row: behaviour of the parameters for the sum of two Rayleigh functions. Second row: time evolution for the combination of one Rayleigh function and one Gaussian function. The temporal evolution followed by the amplitudes (dimensionless – left axis) is plotted with circle markers, whereas the temporal evolution for the functional parameters are shown with star markers (right axis in km s−1). The blue and green markers are associated to the first Rayleigh function component in both proposed distributions, whereas the red, and yellow markers represent the second component, which is either a second Rayleigh function or a Gaussian function. The left side of the panels are calculated from the LOS magnetograms, whereas the right side panels are obtained from the continuum maps. The dashed rectangles enclose the three time instants shown in Fig. 5.
Current usage metrics show cumulative count of Article Views (full-text article views including HTML views, PDF and ePub downloads, according to the available data) and Abstracts Views on Vision4Press platform.
Data correspond to usage on the plateform after 2015. The current usage metrics is available 48-96 hours after online publication and is updated daily on week days.
Initial download of the metrics may take a while.