Fig. 5.
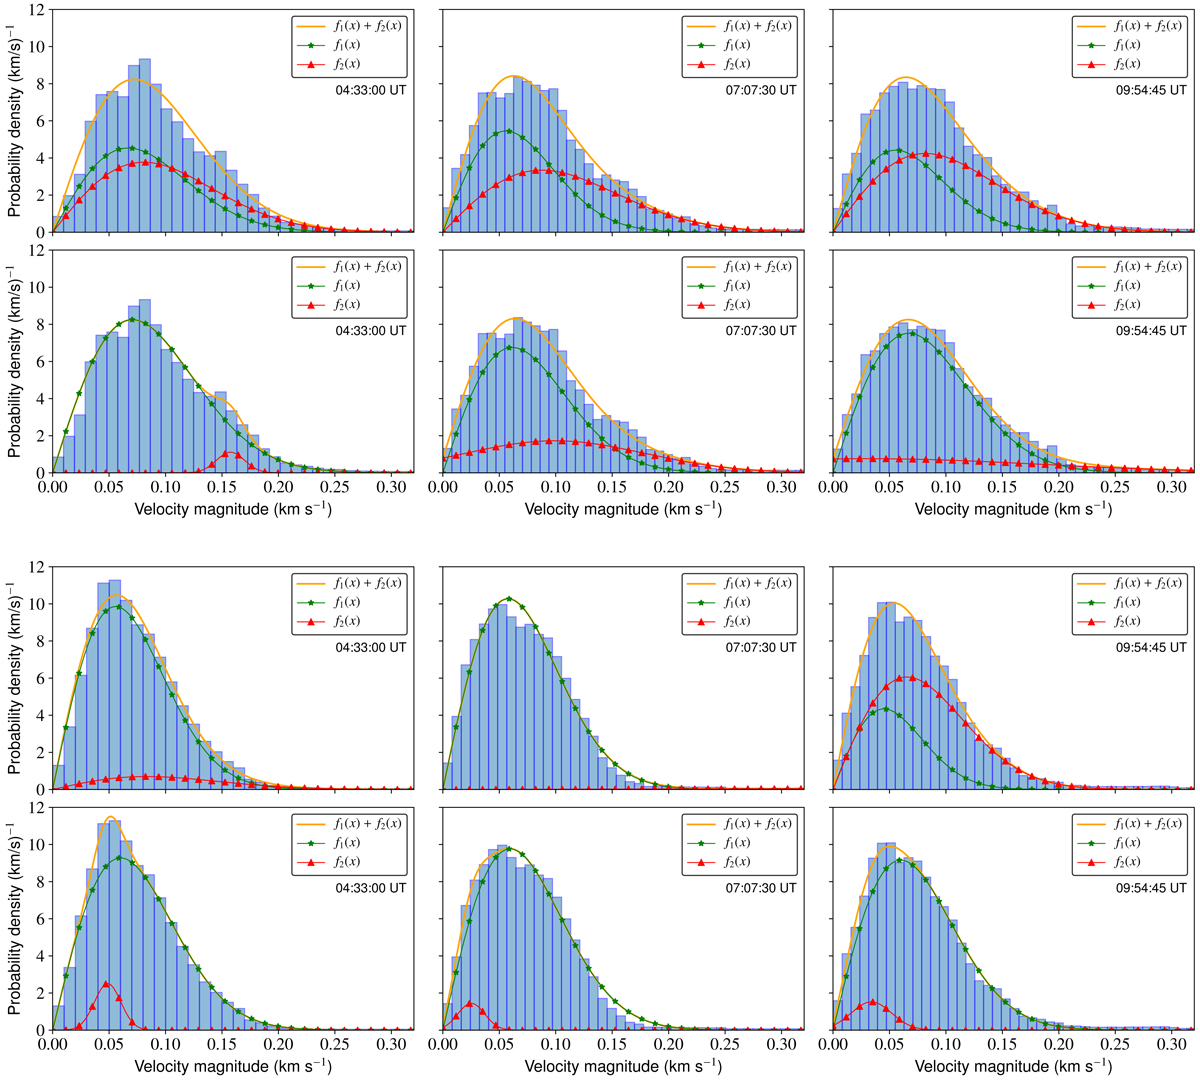
Plots show three test cases for the proposed combination of two-component distributions for the continuum flow maps (lower set of panels) as well as for the magnetic elements motions (upper set of panels). First row in both six panel sets: case of combining two Rayleigh distributions for the total fit. They display the two independent Rayleigh components as well as the sum of the two components to form the whole measured velocity distribution for three different times. Second row for each: case of the combination of a Rayleigh background component with a variable Gaussian component. Times are in universal time (UT).
Current usage metrics show cumulative count of Article Views (full-text article views including HTML views, PDF and ePub downloads, according to the available data) and Abstracts Views on Vision4Press platform.
Data correspond to usage on the plateform after 2015. The current usage metrics is available 48-96 hours after online publication and is updated daily on week days.
Initial download of the metrics may take a while.