Fig. 3.
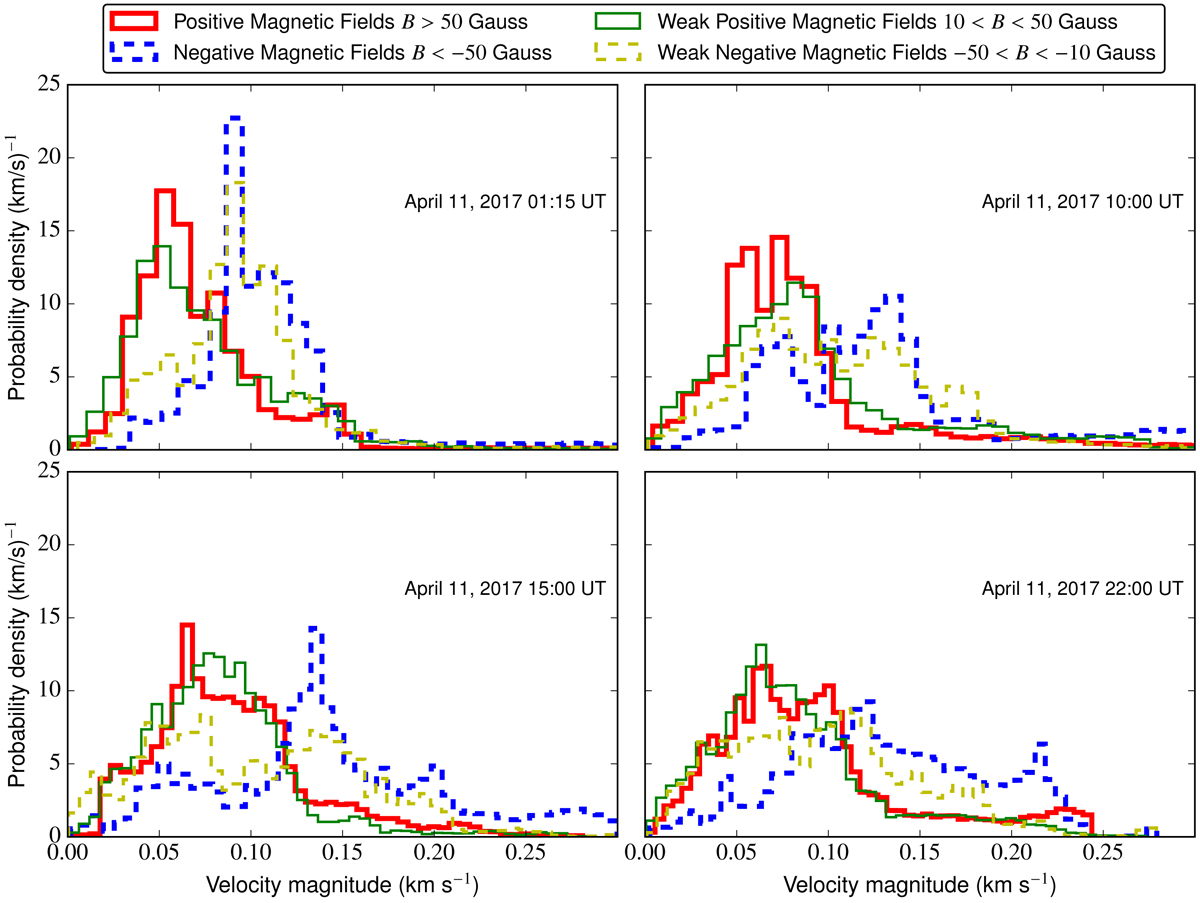
Distribution of magnitudes of velocities (![]() ; speeds) for weak and strong magnetic fields for the times shown in Fig. 2. Red and blue colours (thick lines) describe the velocity distributions for positive and negative magnetic fields greater than 50 Gauss, whereas green and yellow (thin lines) distributions represent the motions of the weaker magnetic elements. The ranges for both the weak positive and negative field strengths are [10 < B < 50 and −50 < B < −10] Gauss. Here, B is the magnetic field strength as obtained from the magnetograms. The solid lines represent the positive magnetic polarity, whereas the dashed lines represent the negative magnetic fields.
; speeds) for weak and strong magnetic fields for the times shown in Fig. 2. Red and blue colours (thick lines) describe the velocity distributions for positive and negative magnetic fields greater than 50 Gauss, whereas green and yellow (thin lines) distributions represent the motions of the weaker magnetic elements. The ranges for both the weak positive and negative field strengths are [10 < B < 50 and −50 < B < −10] Gauss. Here, B is the magnetic field strength as obtained from the magnetograms. The solid lines represent the positive magnetic polarity, whereas the dashed lines represent the negative magnetic fields.
Current usage metrics show cumulative count of Article Views (full-text article views including HTML views, PDF and ePub downloads, according to the available data) and Abstracts Views on Vision4Press platform.
Data correspond to usage on the plateform after 2015. The current usage metrics is available 48-96 hours after online publication and is updated daily on week days.
Initial download of the metrics may take a while.