Fig. 2.
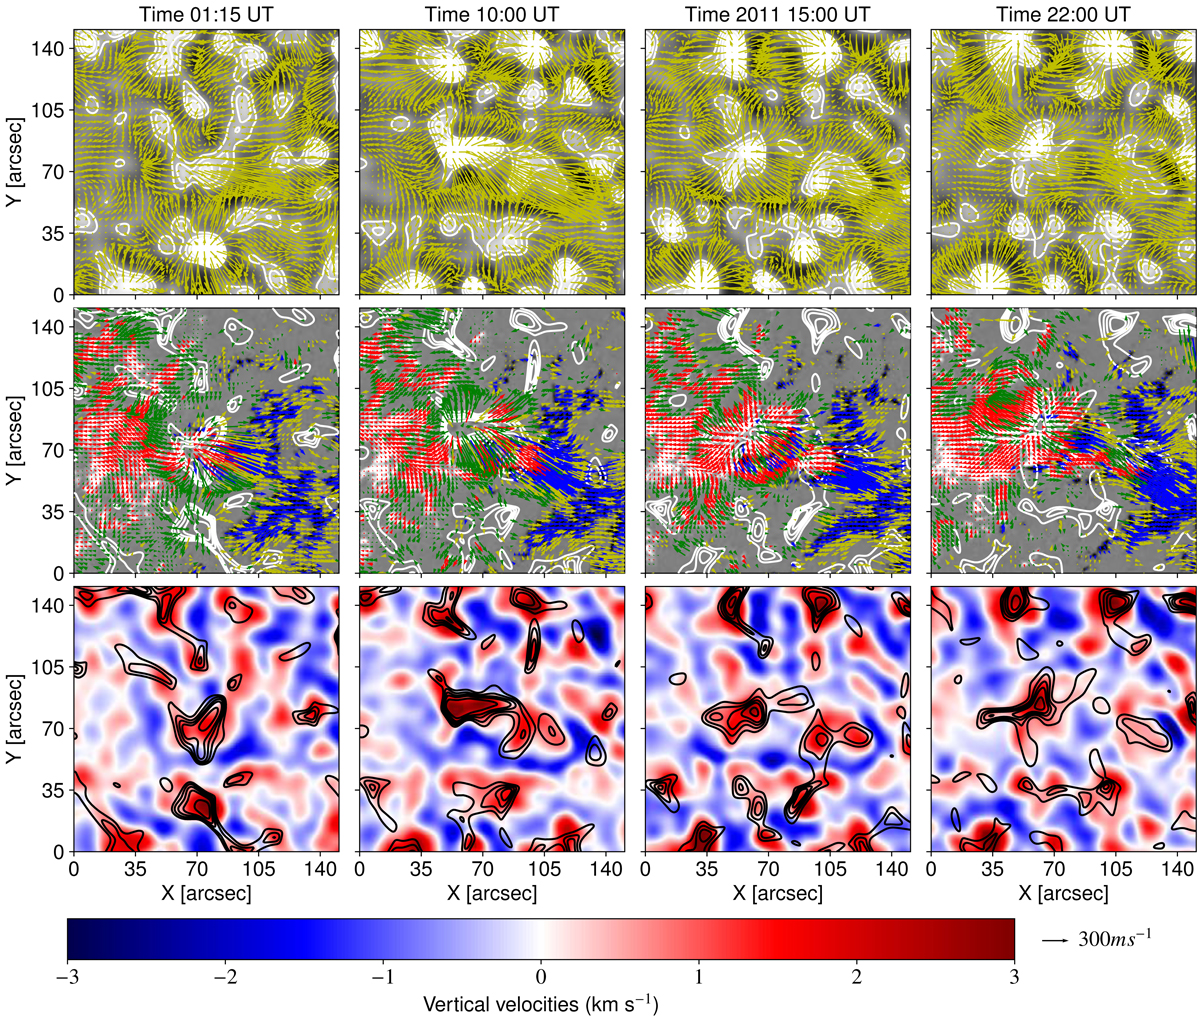
Temporal evolution of the velocity fields within the ROI of AR 11190 at four different times computed by local correlation tracking (LCT) analysis. Horizontal and vertical velocities are inferred from continuum maps as well as from LOS magnetic field maps. Top row: horizontal proper motions (calculated by LCT technique applied to the continuum maps) with the background image being the vertical velocity map, and the contour lines representing positive vertical velocities with contour values of [0.5, 1., 1.5, 2., 3] km s−1. Second row: horizontal velocities of magnetic elements (calculated from LCT analysis over the LOS magnetograms) where the background image represents the LOS magnetic field strength map and the contour lines are ranged as before. The red arrows show the motions of magnetic elements with magnetic strengths greater than 50 Gauss, and the blue arrows display the average movements of negative magnetic elements with values lower than −50 Gauss. The green arrows display horizontal behaviour for weak positive magnetic elements, whereas the yellow arrows display the horizontal proper motions associated with weak negative magnetic field elements. Third row: comparison between the evolution of vertical velocities obtained from the continuum data set and the evolution of positive vertical velocities obtained from the LOS magnetic field data. The black arrow in the bottom right corner represents the length of a velocity vector featuring a magnitude of 300 ms−1.
Current usage metrics show cumulative count of Article Views (full-text article views including HTML views, PDF and ePub downloads, according to the available data) and Abstracts Views on Vision4Press platform.
Data correspond to usage on the plateform after 2015. The current usage metrics is available 48-96 hours after online publication and is updated daily on week days.
Initial download of the metrics may take a while.