Fig. A.2.
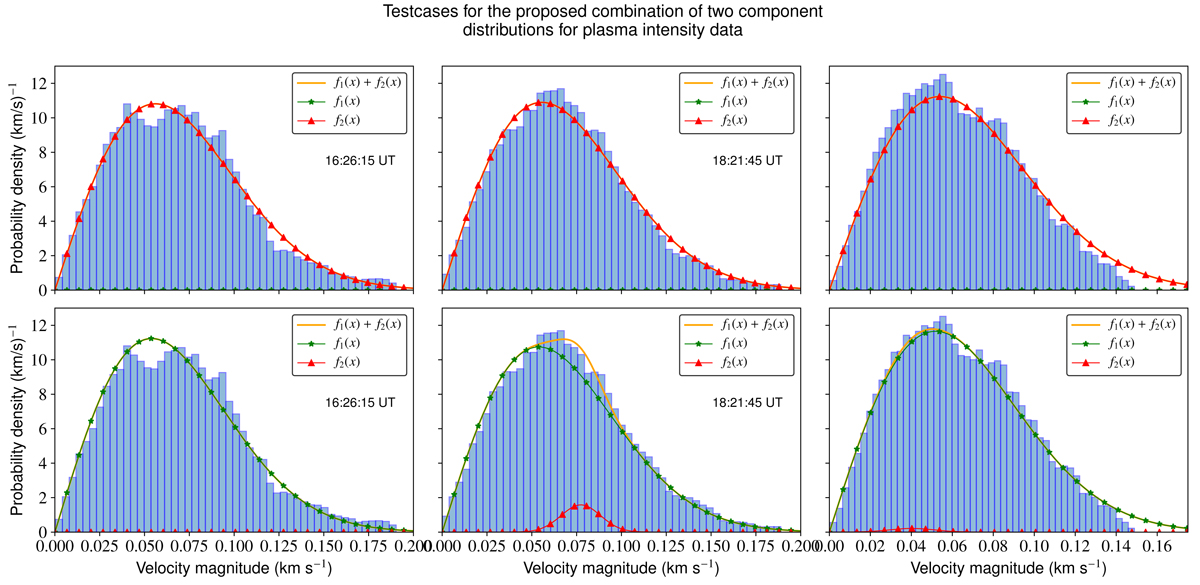
Similar to Fig. 5, but for the quiet Sun region as outlined in Fig. A.1 for three different test cases showing only the distributions obtained from the continuum maps. Thus the arrangement of the panels is as follows: top row: histograms of velocity as computed from the continuum maps for three different times applying a double Rayleigh component distribution fit, bottom panels: combination of Rayleigh and Gaussian distribution (all cases obtained from continuum maps).
Current usage metrics show cumulative count of Article Views (full-text article views including HTML views, PDF and ePub downloads, according to the available data) and Abstracts Views on Vision4Press platform.
Data correspond to usage on the plateform after 2015. The current usage metrics is available 48-96 hours after online publication and is updated daily on week days.
Initial download of the metrics may take a while.