Fig. 1.
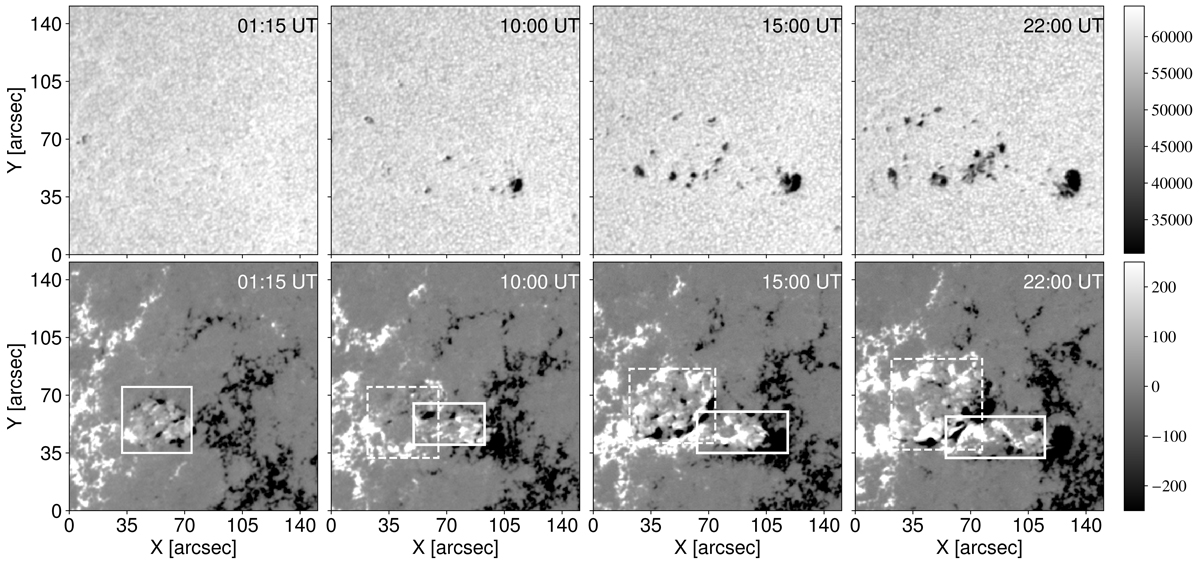
Selected active region (AR) as observed on April 11, 2011 exhibits a complex configuration with sunspots harbouring partial penumbrae and pores. First row: time evolution of the continuum images for AR 11190 that displays a rapid evolution. Second row: series of LOS magnetograms for AR 11190 with positive and negative (white and black) magnetic polarities used to track the evolution of emergent positive magnetic field. The solid box encloses the region of an initial positive magnetic emergence, while the dashed box outlines a second emergent cell evolving faster and thus pushing and suppressing the first emergence. The colour bar in the first row displays the intensity values clipped between 45% and 95% of the image featuring the largest intensity, whereas the colour bar in the second row shows the LOS magnetic field maps clipped in the range between −250 and +250 Gauss. A clearer understanding can be obtained by watching the full evolution of the active region in the movie provided, which shows the magnetic field on a false colour table from −2500 G to +2500 G, and the continuum maps normalized over the average of all the maximum (see online movie).
Current usage metrics show cumulative count of Article Views (full-text article views including HTML views, PDF and ePub downloads, according to the available data) and Abstracts Views on Vision4Press platform.
Data correspond to usage on the plateform after 2015. The current usage metrics is available 48-96 hours after online publication and is updated daily on week days.
Initial download of the metrics may take a while.