Fig. 9.
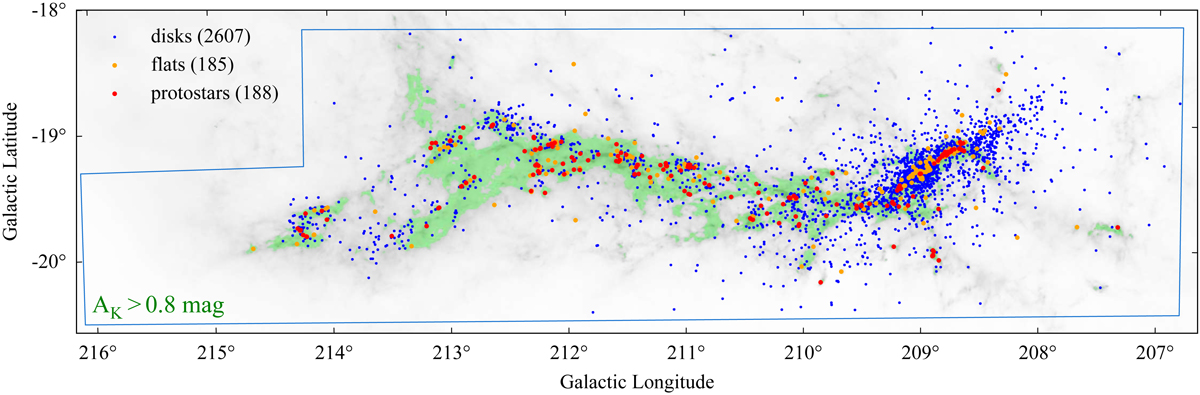
The green shaded area indicates the extinction threshold of AK, Herschel > 0.8 mag. Superimposed are the YSO candidates (see legend). For each source we calculate the projected distance to the closest pixel in the Herschel map (green) above the extinction threshold. The resulting normalized cumulative distribution is shown in Fig. 10.
Current usage metrics show cumulative count of Article Views (full-text article views including HTML views, PDF and ePub downloads, according to the available data) and Abstracts Views on Vision4Press platform.
Data correspond to usage on the plateform after 2015. The current usage metrics is available 48-96 hours after online publication and is updated daily on week days.
Initial download of the metrics may take a while.