Fig. 7.
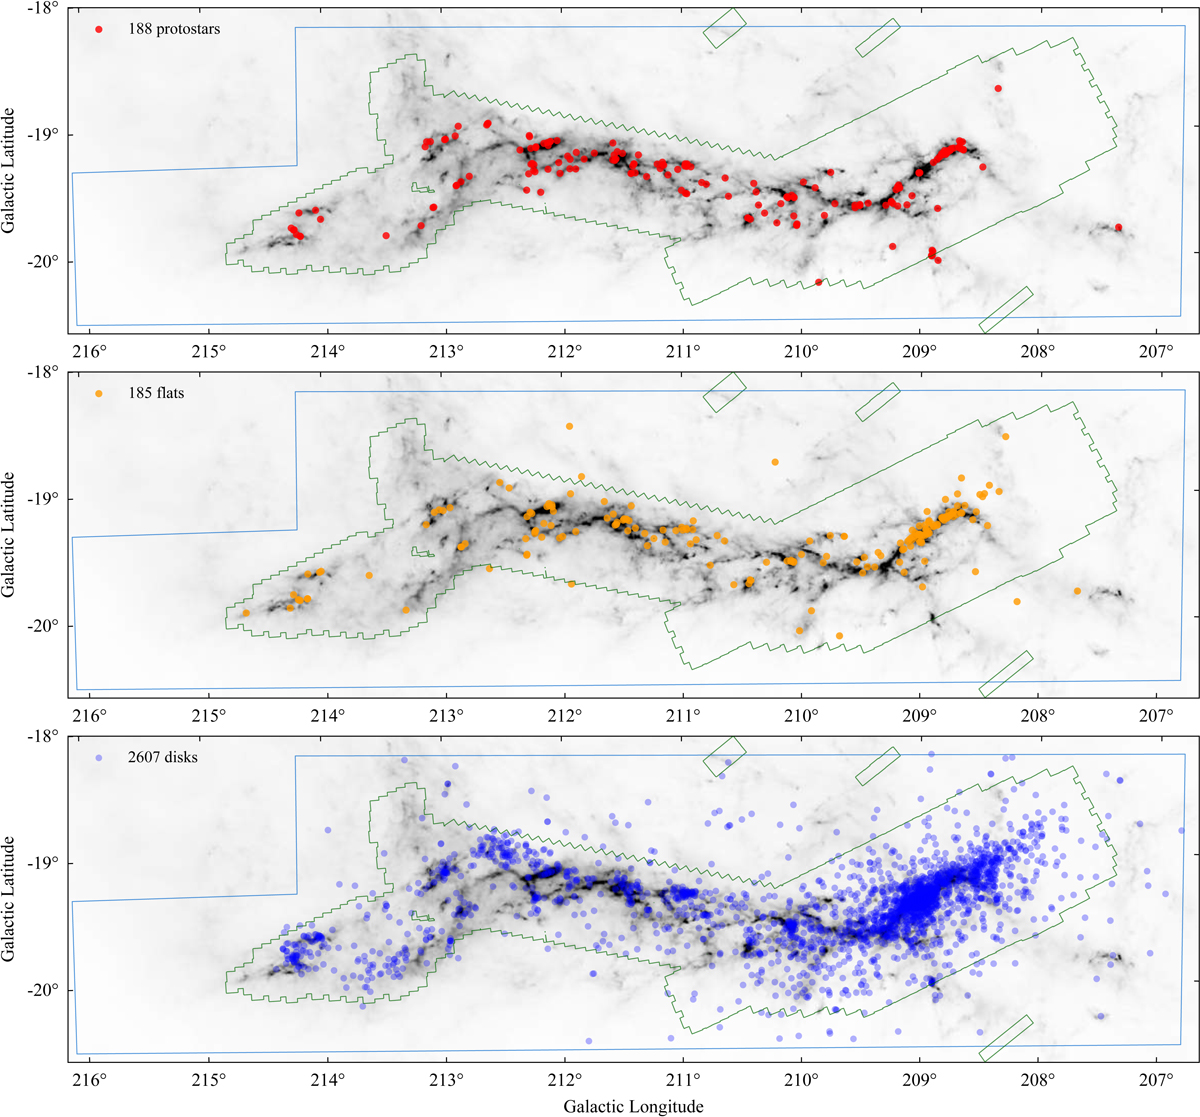
Distribution of all 2980 YSO candidates as selected and classified in this work. The classes are shown separately from top to bottom: protostar (Class 0/I, top panel, red), flat-spectrum (middle panel, orange), and disk candidates (Class II/III, bottom panel, blue), displayed on the Herschel map. The Spitzer/IRAC and VISTA coverage contours are shown in green and blue, respectively. This highlights the location of new sources in the surroundings and the limitations of the VISTA survey coverage.
Current usage metrics show cumulative count of Article Views (full-text article views including HTML views, PDF and ePub downloads, according to the available data) and Abstracts Views on Vision4Press platform.
Data correspond to usage on the plateform after 2015. The current usage metrics is available 48-96 hours after online publication and is updated daily on week days.
Initial download of the metrics may take a while.