Fig. B.6.
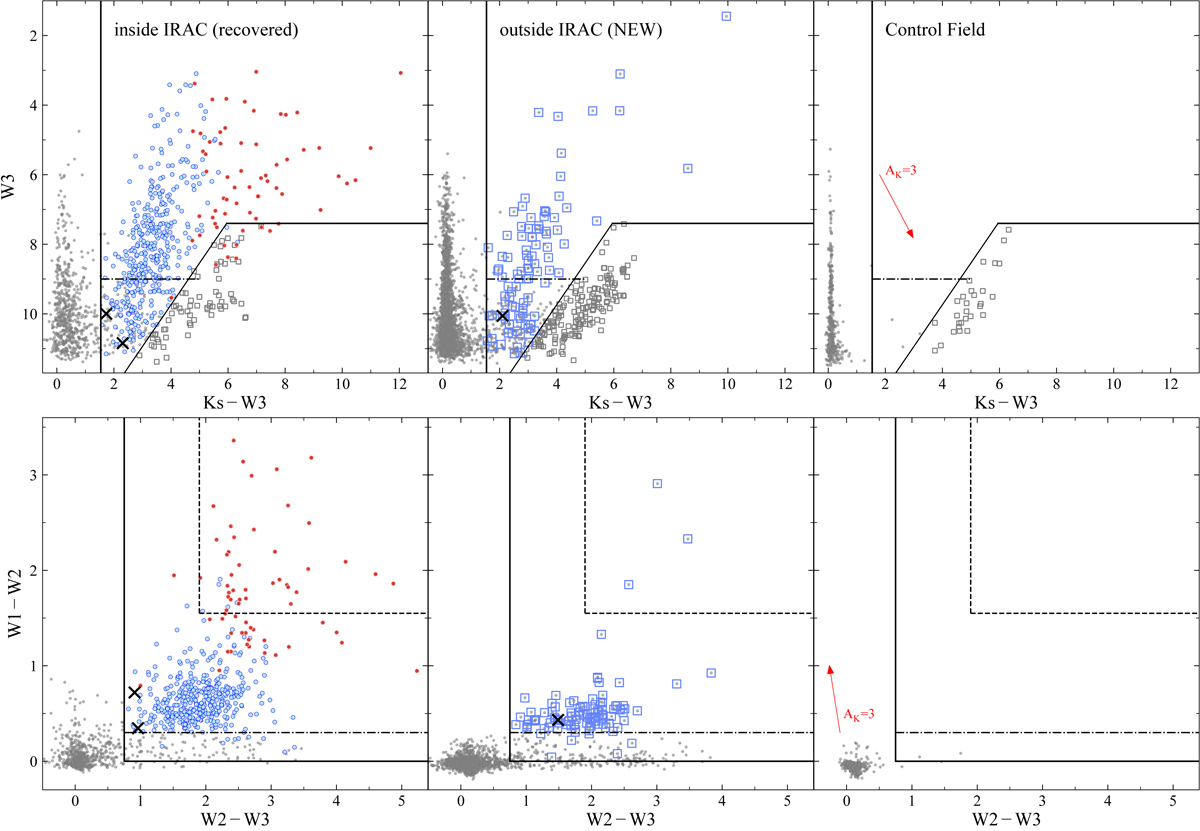
W123-selection. Left panel: Orion A science field inside the IRAC coverage for L1641, showing recovered YSO candidates (blue – disks, red – protostars). Center panel: Orion A science field outside the IRAC coverage showing new YSO candidates (blue open squares). Right panel: control field showing background and MS star contamination. Top panel: Ks − W3 vs W3 CMD. To clean the sample of extra-galactic contamination we exclude sources below and right to the black lines (AGN-cut, gray open boxes). The left border reduces contaminated W3 photometry and eliminates MS stars. Bottom panel: W2 − W3 vs W1 − W2 CCD. The black lines show the selection conditions. Sources from the AGN-cut are already removed. The slope on the left separates MS stars. The cut at the bottom reduces contaminated photometry. The dashed black lines in the upper right corner show an additional selection of sources where the AGN-cut was not applied due to the fact that this region is free of any contamination. The horizontal black dashed lines in both diagrams show the exclusion condition for faint sources (W3 > 9 mag) which at the same time fall below W1 − W2 < 0.4.
Current usage metrics show cumulative count of Article Views (full-text article views including HTML views, PDF and ePub downloads, according to the available data) and Abstracts Views on Vision4Press platform.
Data correspond to usage on the plateform after 2015. The current usage metrics is available 48-96 hours after online publication and is updated daily on week days.
Initial download of the metrics may take a while.