Fig. 2.
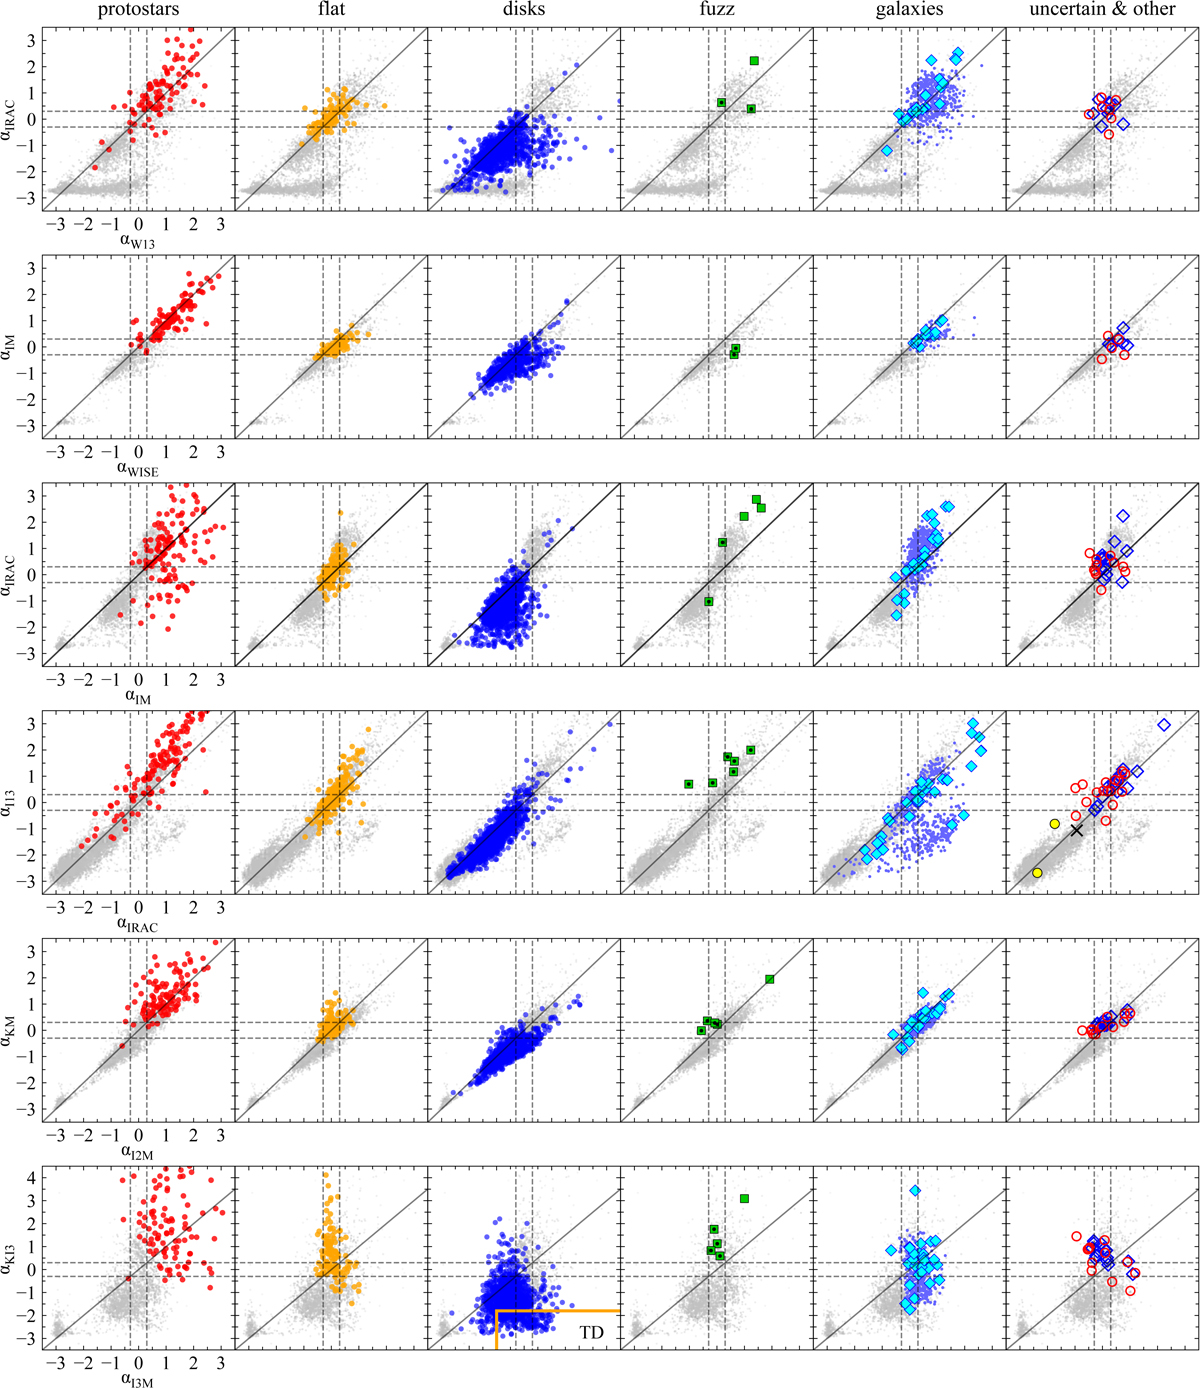
Comparing various observed spectral indices (α). The used spectral indices are listed in Table 4. Shown are YSO candidates and false positives, with symbols like in Fig. 3. A slope one line is given (black solid line), highlighting where different spectral indices give the same value. The range for flat-spectrum sources is indicated by dashed lines. Two top rows: comparison of Spitzer and WISE spectral indices, covering approximately the same spectral range. The protostars contain sources with declining α in some spectral ranges. We found that most of these are influenced by visible outflows. The solid orange outline (last row, third column) indicates a transition disk selection (see text for more explanations).
Current usage metrics show cumulative count of Article Views (full-text article views including HTML views, PDF and ePub downloads, according to the available data) and Abstracts Views on Vision4Press platform.
Data correspond to usage on the plateform after 2015. The current usage metrics is available 48-96 hours after online publication and is updated daily on week days.
Initial download of the metrics may take a while.