Free Access
Fig. B.4.
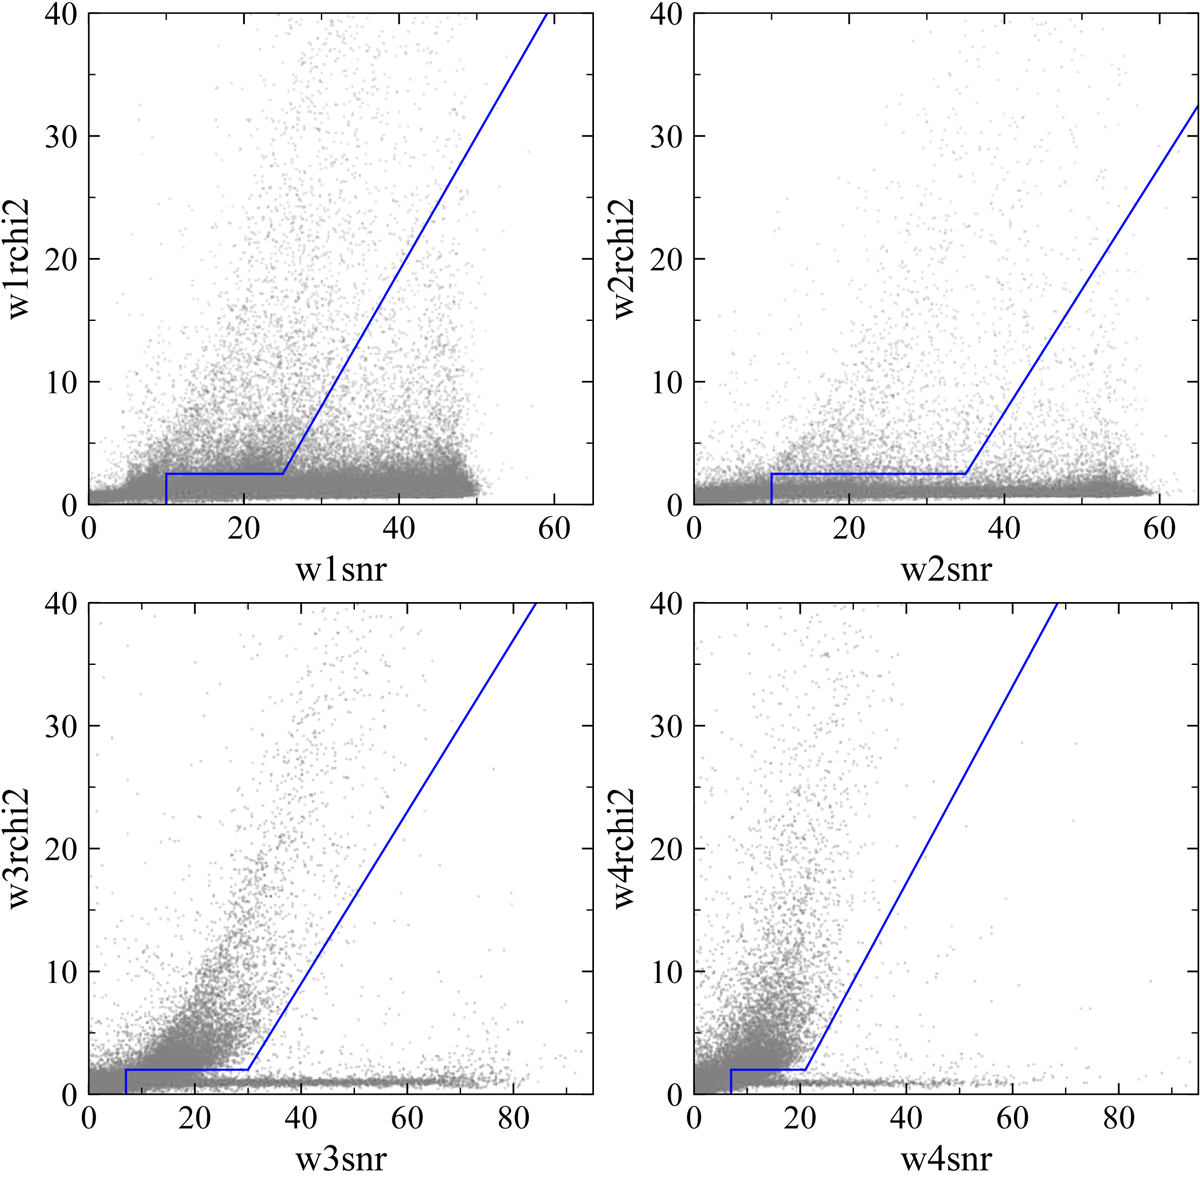
S/N versus reduced chi square for each WISE band. The blue lines show the cuts (S/N-RCHI2-cut) to reduce fake point sources (similar to Koenig & Leisawitz 2014). Sources to the left of the blue borders are excluded, as given in Eqs. (B.14)–(B.17).
Current usage metrics show cumulative count of Article Views (full-text article views including HTML views, PDF and ePub downloads, according to the available data) and Abstracts Views on Vision4Press platform.
Data correspond to usage on the plateform after 2015. The current usage metrics is available 48-96 hours after online publication and is updated daily on week days.
Initial download of the metrics may take a while.