Fig. B.3.
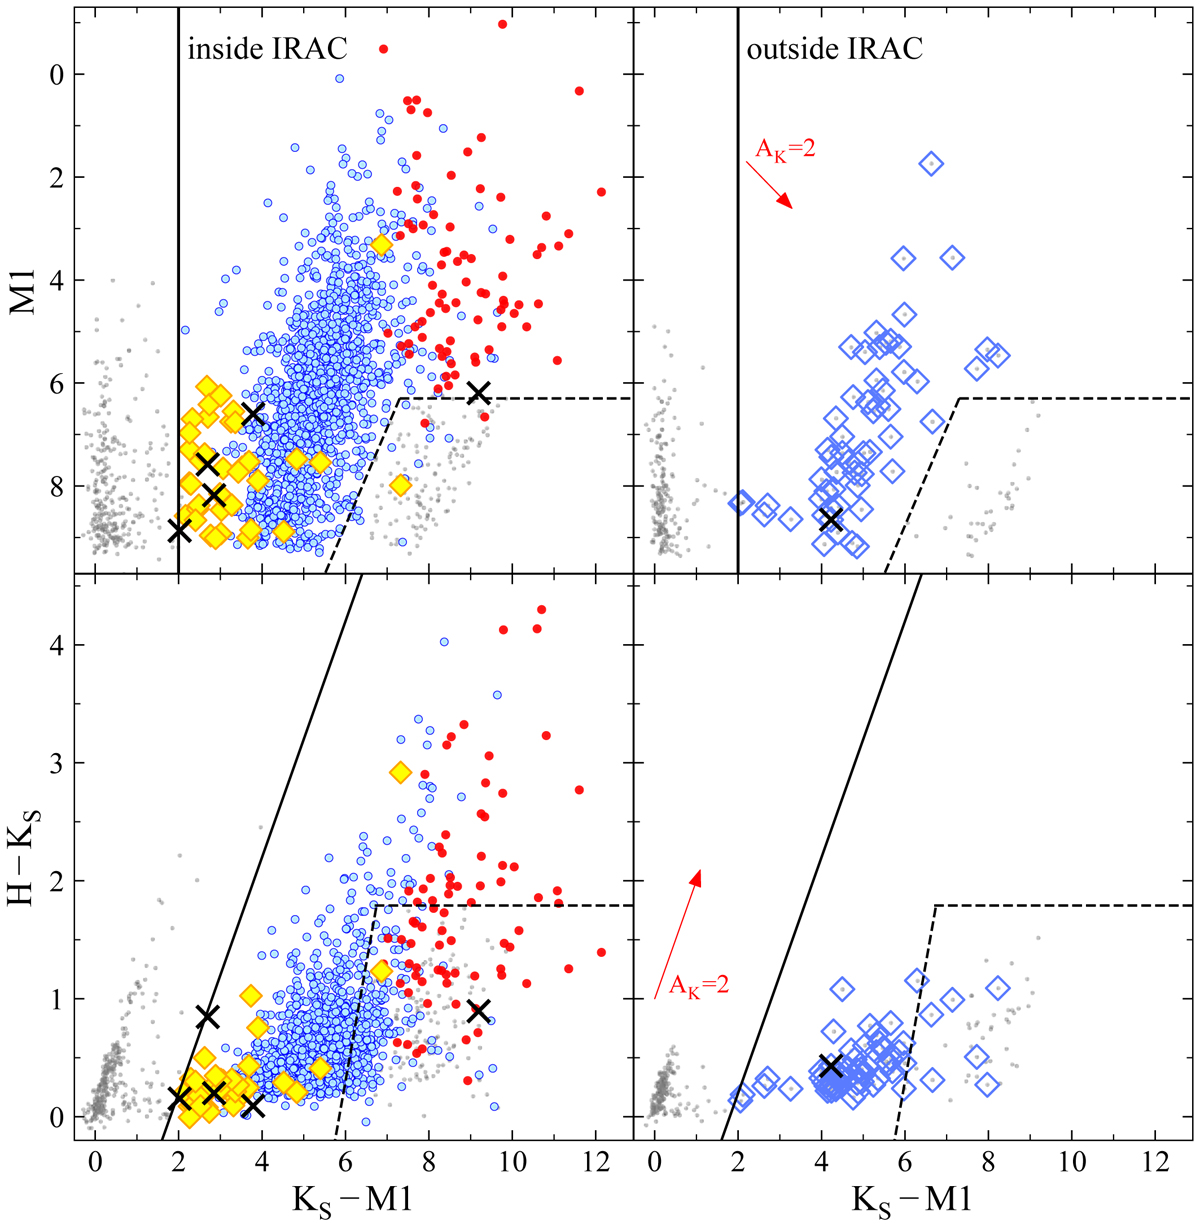
Top panel: CMD M1 vs Ks − M1. Bottom panel: CCD H − Ks vs Ks − M1. Left panel: selection of YSOs inside the IRAC coverage, showing the recovered sources (disks – blue, protostars – red). Yellow filled diamonds are new YSO candidates and the black crosses are contaminates or uncertain sources. Right panel: selected new YSO candidates outside the IRAC region (open blue diamonds). The extinction vector is shown for both diagrams in red with a length of AK = 2 mag. The black solid lines represent cuts to exclude MS stars, and the black dashed lines exclude extra-galactic sources.
Current usage metrics show cumulative count of Article Views (full-text article views including HTML views, PDF and ePub downloads, according to the available data) and Abstracts Views on Vision4Press platform.
Data correspond to usage on the plateform after 2015. The current usage metrics is available 48-96 hours after online publication and is updated daily on week days.
Initial download of the metrics may take a while.