Fig. B.1.
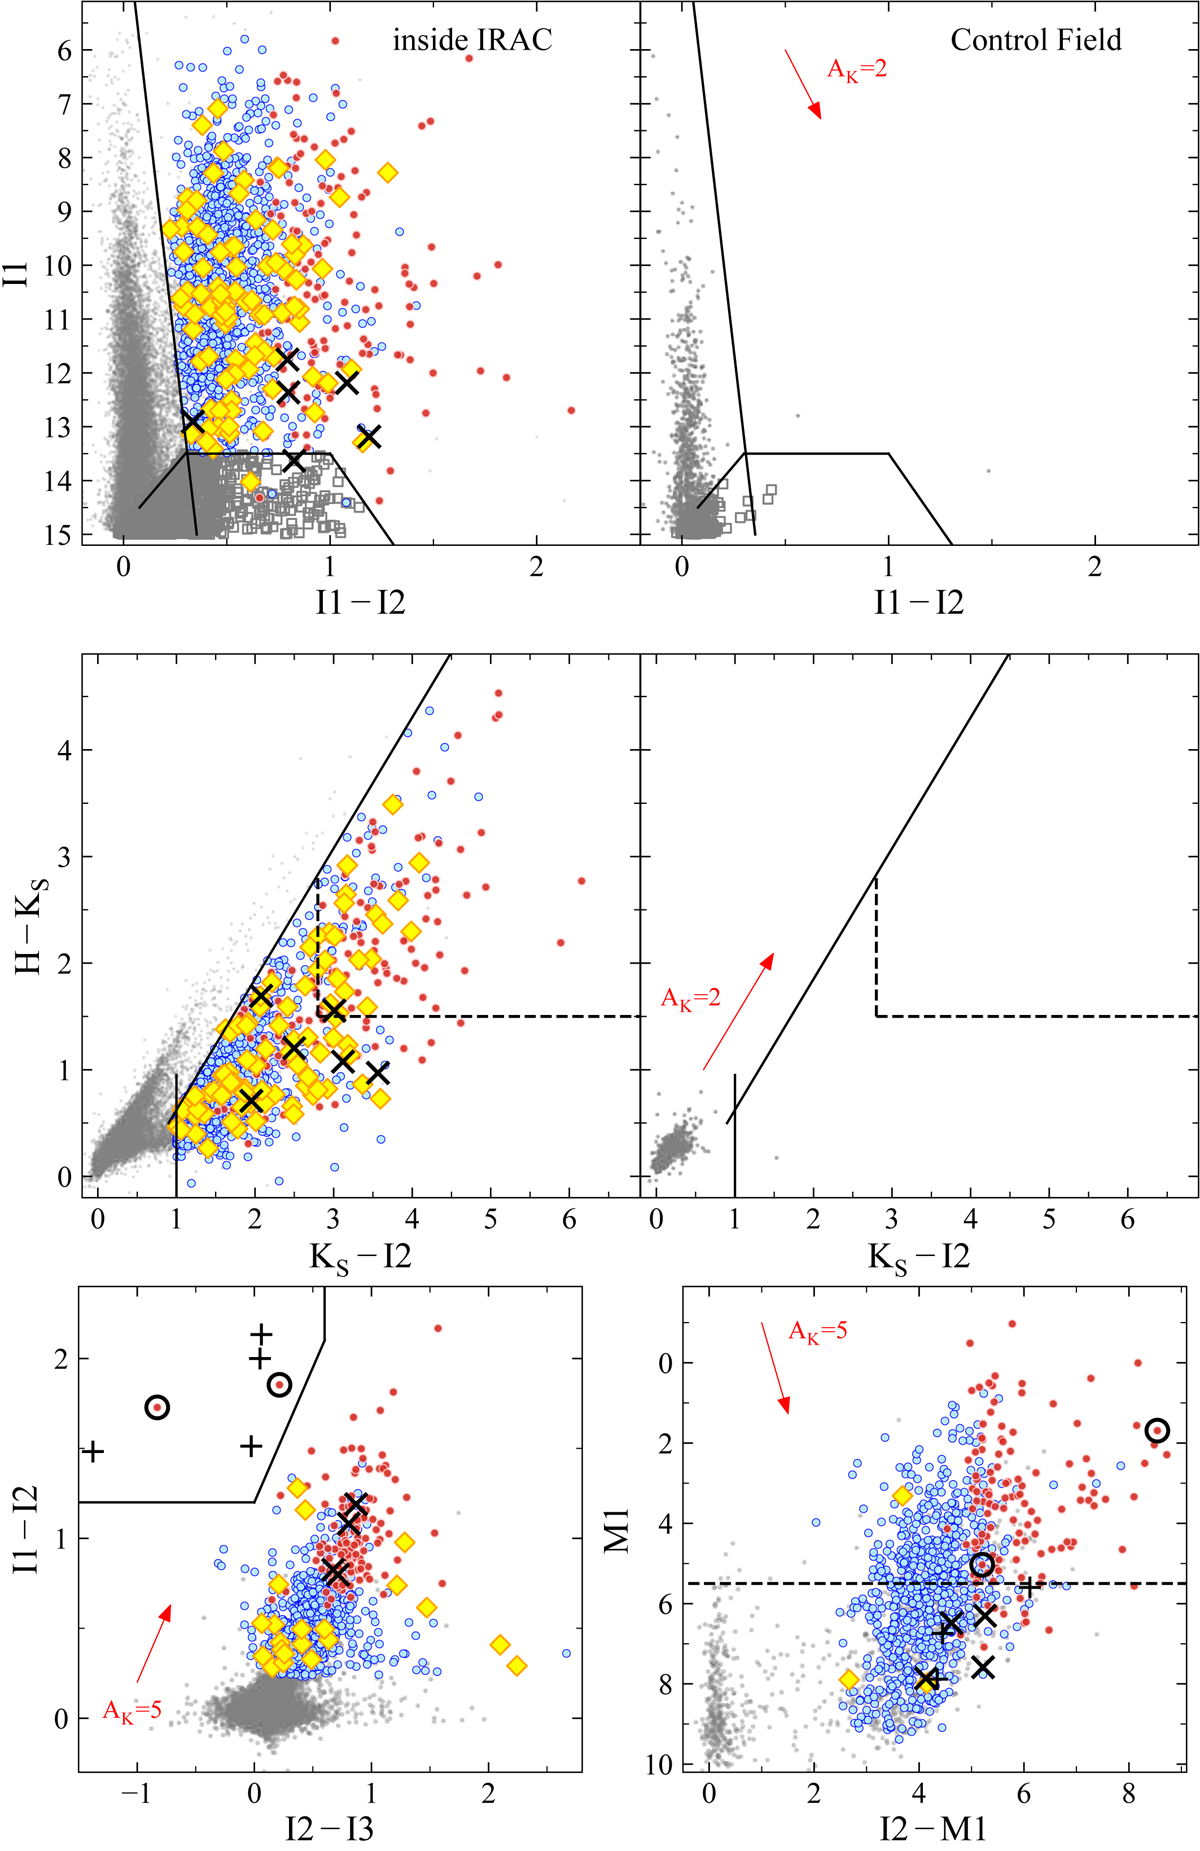
CCDs and CMDs showing the HKI12-selection. Top panel: I1 vs I1 − I2 color–magnitude diagram for the science and control field. Middle panel: H − Ks vs Ks − I2 color–color diagram for the science and control field. The science fields (left panel) show the YSO selection inside the IRAC coverage (yellow filled diamonds), while the recovered sources are highlighted as well (disks – blue, protostars – red). Black crosses mark contamination or uncertain sources. The control fields (right panel) are used to exclude background contamination. The extinction vector is shown in red with a length of AK = 2 mag. Bottom panel: shock emission exclusion for sources with valid I3 measurements for the HKI12-selection. Symbols are the same as above in the science field plots. Additionally we show black plus symbols, marking sources that are caused by shock emission, and therefore are excluded. The open black circles mark sources which fall in the color region of shock emission, but which are likely YSO candidates, by showing a significant M1 measurement.
Current usage metrics show cumulative count of Article Views (full-text article views including HTML views, PDF and ePub downloads, according to the available data) and Abstracts Views on Vision4Press platform.
Data correspond to usage on the plateform after 2015. The current usage metrics is available 48-96 hours after online publication and is updated daily on week days.
Initial download of the metrics may take a while.