Fig. 10.
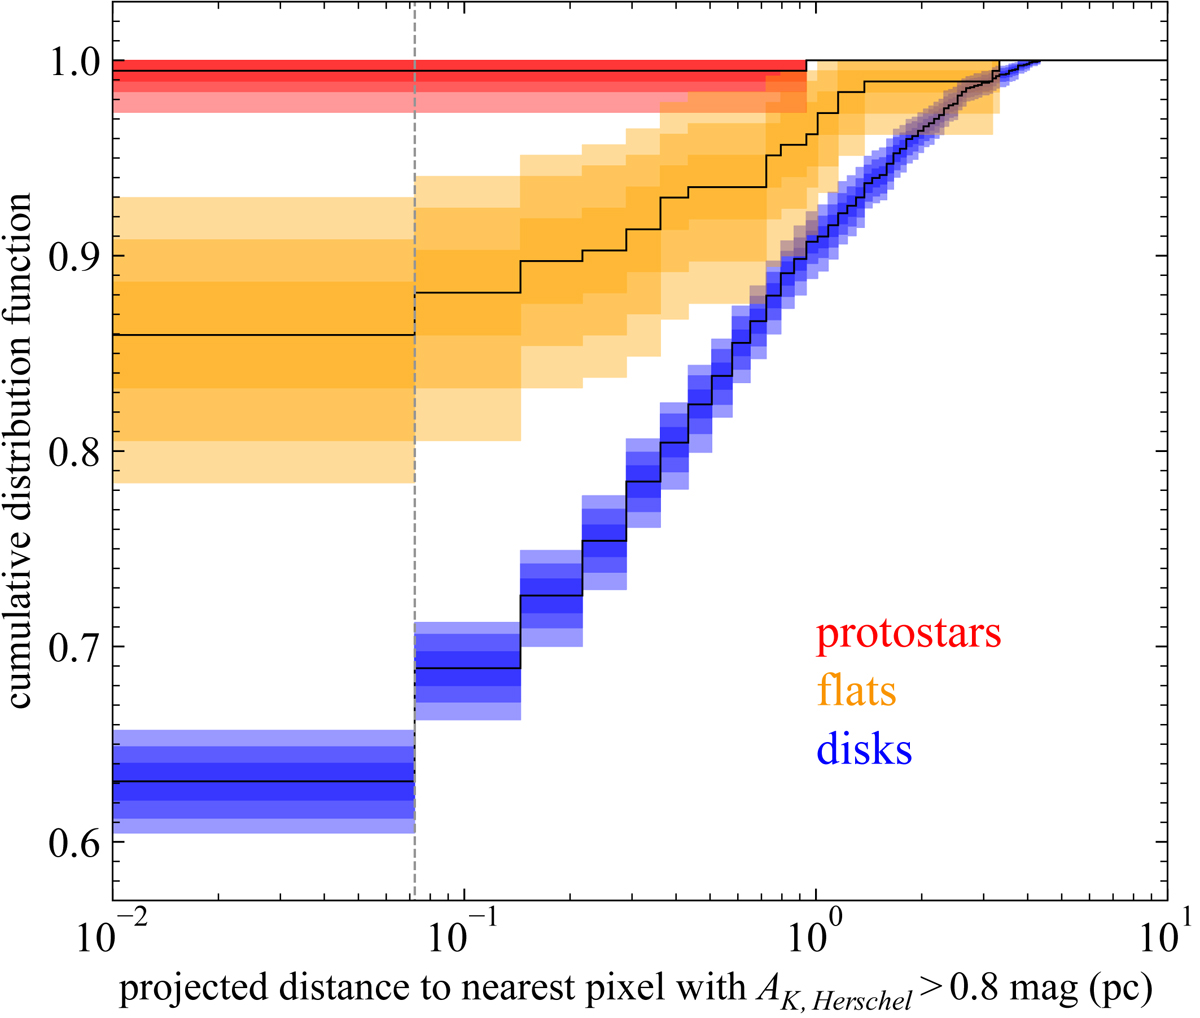
Normalized cumulative distribution of the projected distances of YSOs to the nearest Herschel map pixel with AK, Herschel > 0.8 mag (green pixels, Fig. 9). Separated in colors are the three YSO classes: Class I (protostars, red), flat-spectrum sources (flats, orange), and Class II/III (disks, blue). The observed distributions are shown as black lines, and the color shaded areas show the confidence interval contours at 68.3%, 95%, and 99.7% (1 σ, 2 σ, and 3 σ). The first bin, indicated by the vertical gray dashed line, gives the resolution of Herschel (36″, 0.07 pc at 414 pc). Hence, sources in the first bin are projected directly on top of regions of high dust column-density.
Current usage metrics show cumulative count of Article Views (full-text article views including HTML views, PDF and ePub downloads, according to the available data) and Abstracts Views on Vision4Press platform.
Data correspond to usage on the plateform after 2015. The current usage metrics is available 48-96 hours after online publication and is updated daily on week days.
Initial download of the metrics may take a while.