Fig. 1.
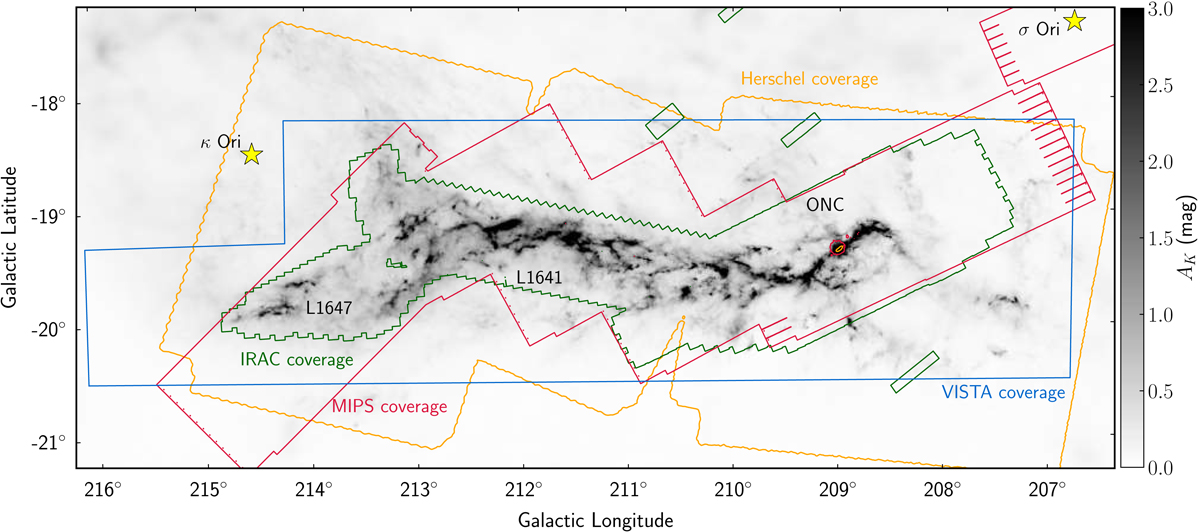
Survey footprints displayed on top of the Planck-Herschel-Extinction dust column-density map (Lombardi et al. 2014). The grayscale shows the line of sight extinction, given in AK, Herschel (mag). The contours show the survey coverages for VISTA (blue), Spitzer/IRAC1 (green), Spitzer/MIPS1 (red), and Herschel (orange). The small green boxes are control fields for the Spitzer/IRAC bands, which are partially overlapping with VISTA. The red and orange circles, located at the position of the ONC, result from saturated MIPS1 and Herschel photometry respectively. Indicated are the two main regions in Orion A, the Lynds dark cloud L1641 (including L1647), and the ONC region. The B-star κ-Ori and the O-star σ-Ori are marked for orientation. See also Fig. 1 in Paper I for an overview of some sub-regions.
Current usage metrics show cumulative count of Article Views (full-text article views including HTML views, PDF and ePub downloads, according to the available data) and Abstracts Views on Vision4Press platform.
Data correspond to usage on the plateform after 2015. The current usage metrics is available 48-96 hours after online publication and is updated daily on week days.
Initial download of the metrics may take a while.