Fig. 7.
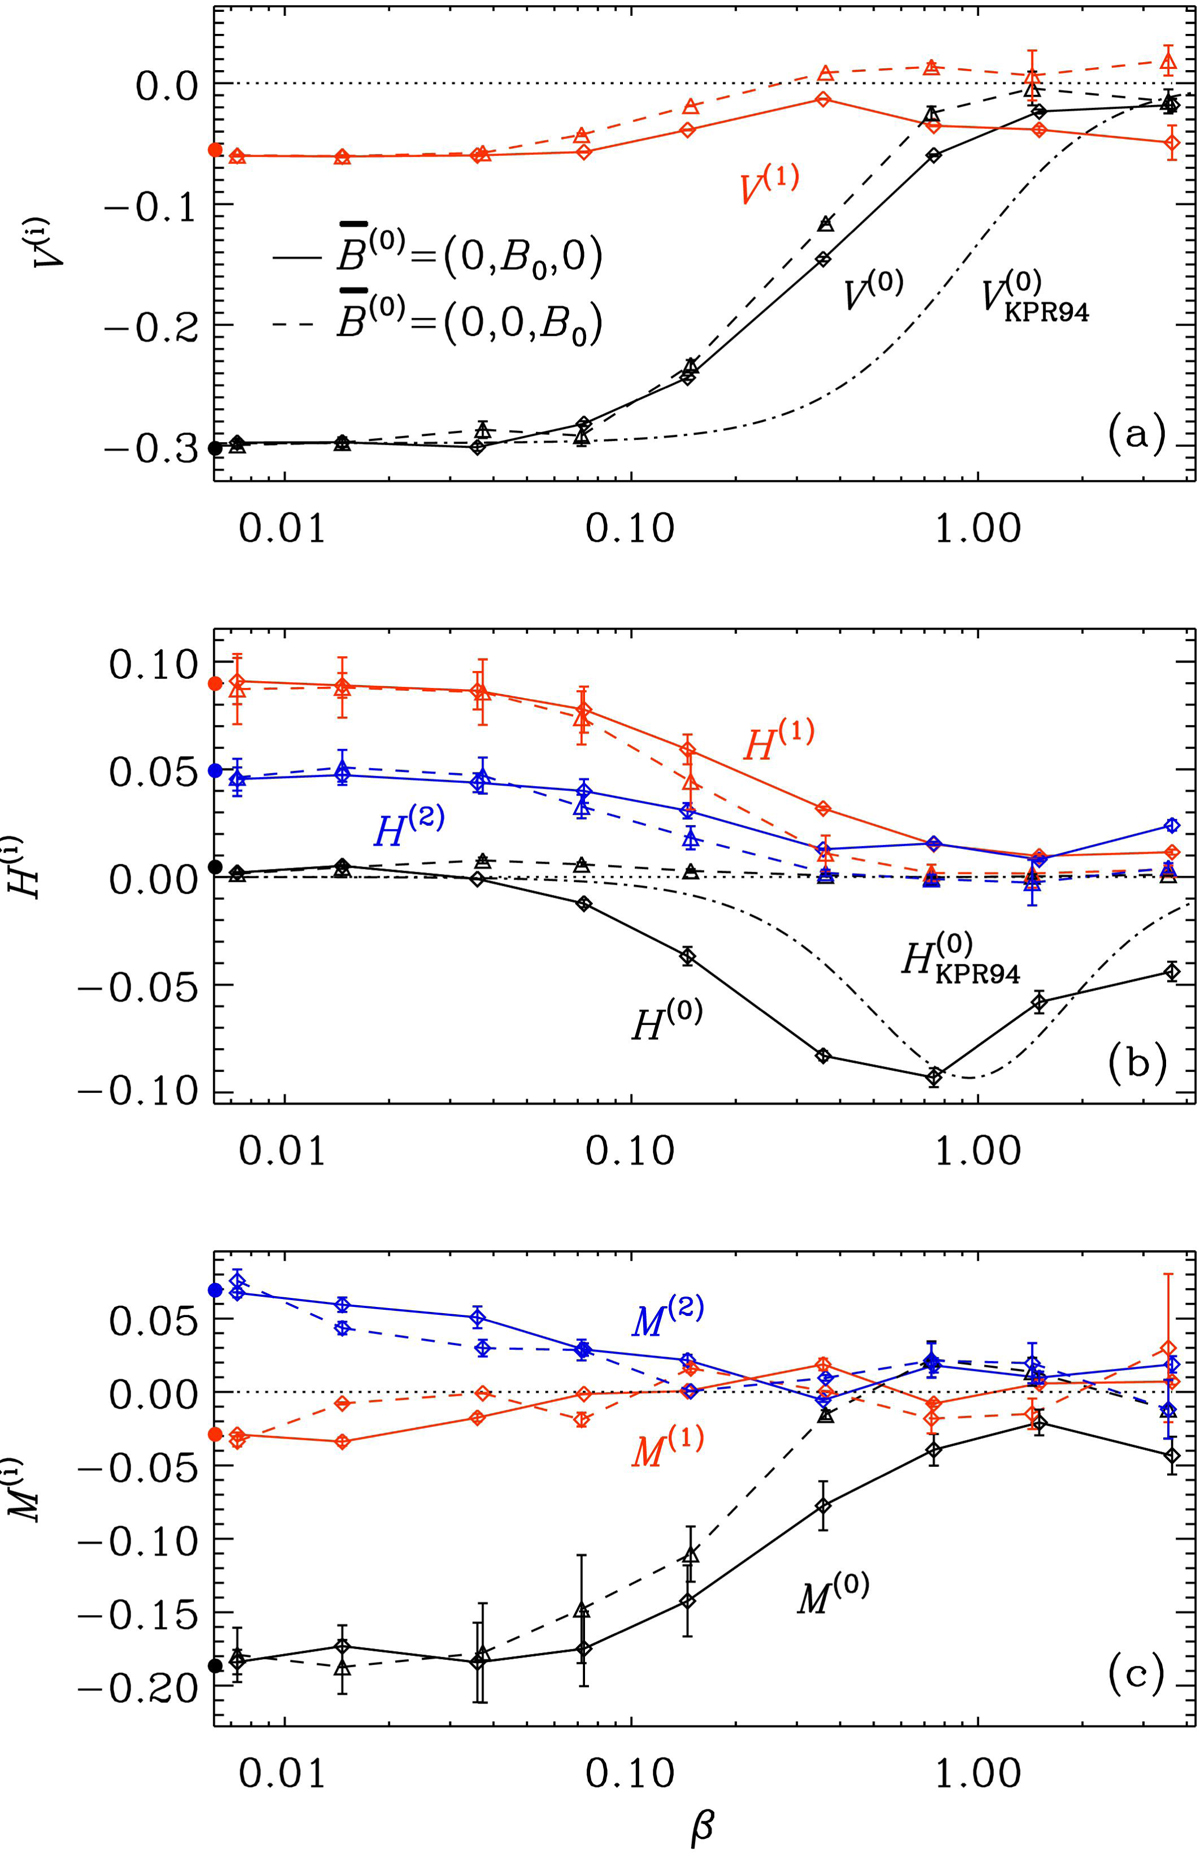
Coefficients V(i) (panel a), H(i) (panel b), and M(i) (panel c) as functions of β. Solid (dashed) lines correspond to runs with an imposed horizontal (vertical) field. The dotted horizontal line denotes the zero level. The open circles on the left axis indicate the hydrodynamic values from Set E. The dash-dotted lines show analytic results according to Eq. (50) (panel a) and Eq. (51) (panel b).
Current usage metrics show cumulative count of Article Views (full-text article views including HTML views, PDF and ePub downloads, according to the available data) and Abstracts Views on Vision4Press platform.
Data correspond to usage on the plateform after 2015. The current usage metrics is available 48-96 hours after online publication and is updated daily on week days.
Initial download of the metrics may take a while.