Free Access
Fig. 2.
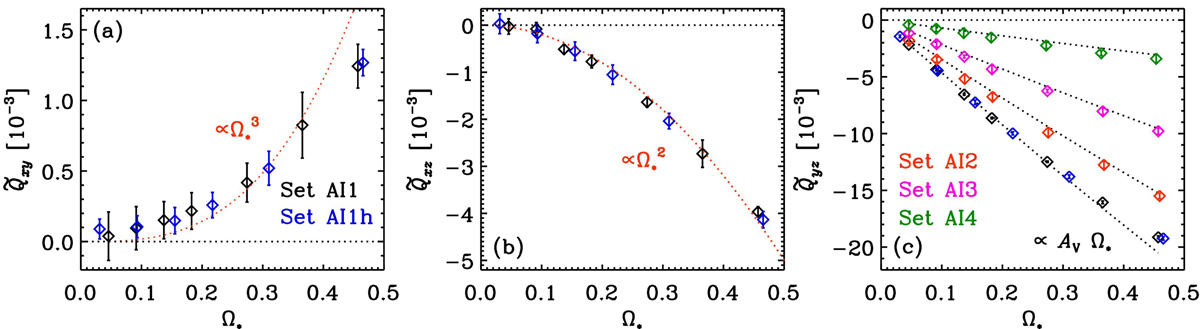
Normalized Reynolds stress components Qxy, Qxz, and Qyz, panels a–c, respectively, from θ = 45° as functions of Ω⋆. In panels a and b data from Sets AI1 and AI1h is shown, whereas in panel c additional data from Sets AI2–4 is included. The dotted lines in panel c are proportional to AVΩ⋆.
Current usage metrics show cumulative count of Article Views (full-text article views including HTML views, PDF and ePub downloads, according to the available data) and Abstracts Views on Vision4Press platform.
Data correspond to usage on the plateform after 2015. The current usage metrics is available 48-96 hours after online publication and is updated daily on week days.
Initial download of the metrics may take a while.