Fig. 8.
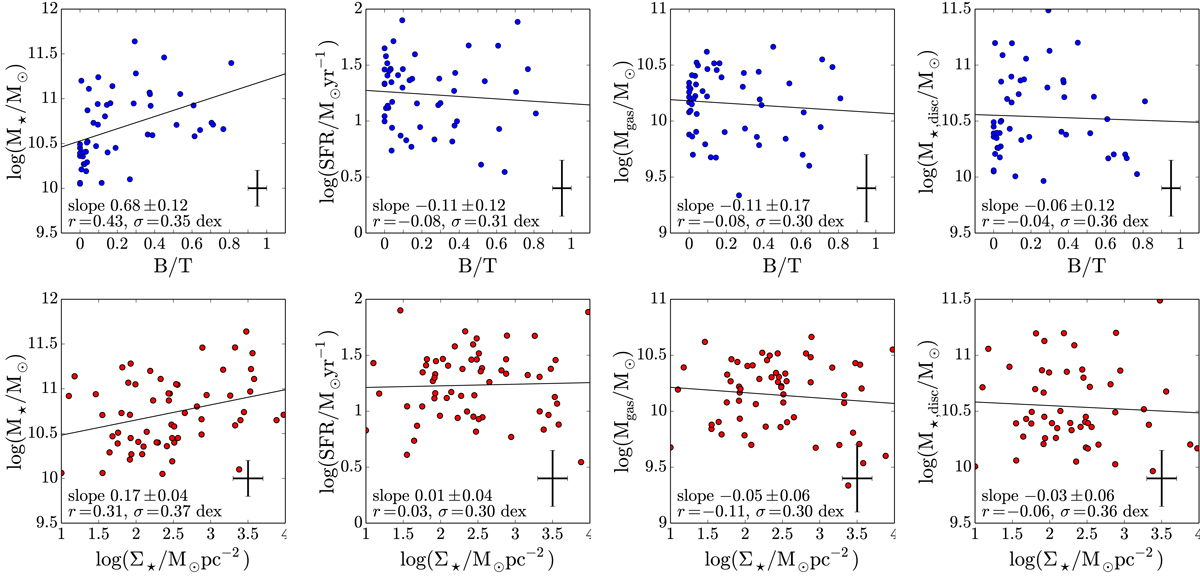
Dependence of different galaxy parameters on the bulge-to-total ratio B/T within the PHIBSS2 sample at z = 0.5 − 0.8. In each panel, we carry out a linear least-square fit shown as a black solid line and indicate its slope, assuming 0.3 dex errors on the different quantities, as well as the Pearson correlation coefficient (r) and the scatter of the residuals of the best-fitting linear relation (σ). Assumed errors are indicated in the lower-right corners.
Current usage metrics show cumulative count of Article Views (full-text article views including HTML views, PDF and ePub downloads, according to the available data) and Abstracts Views on Vision4Press platform.
Data correspond to usage on the plateform after 2015. The current usage metrics is available 48-96 hours after online publication and is updated daily on week days.
Initial download of the metrics may take a while.