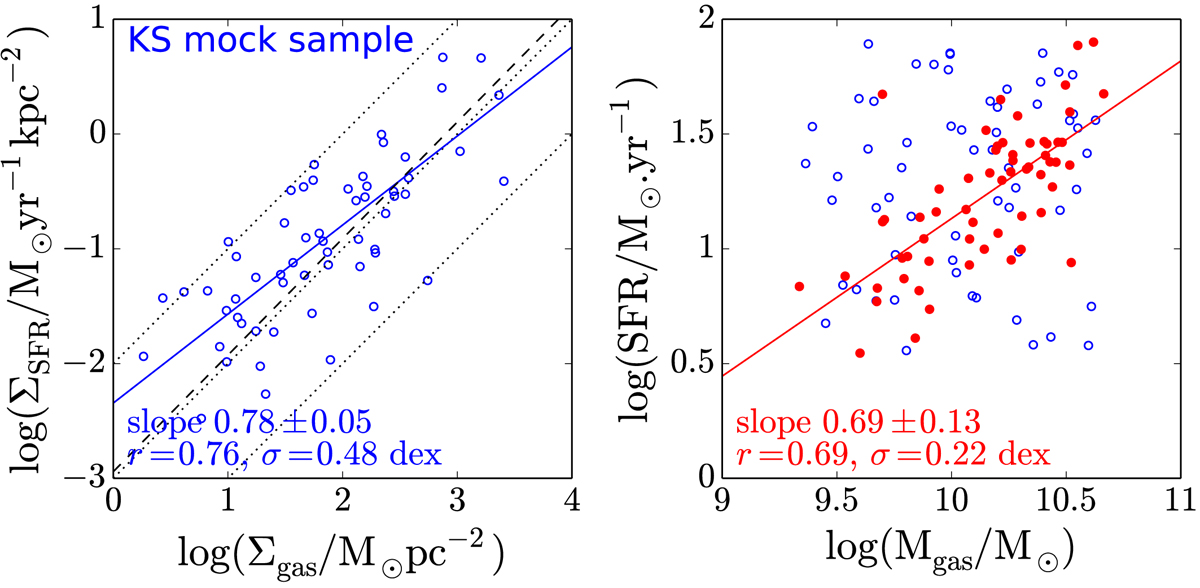
Fig. 7.

Left panel: Kennicutt–Schmidt relation for a mock sample where the molecular gas mass and the SFR are not correlated and their logarith2 uniformly distributed between the extrema of the PHIBSS2 z = 0.5 − 0.8 sample, assuming a Gaussian distribution for log(RSersic/kpc) with mean and standard deviation corresponding to those of the PHIBSS2 sample. The solid blue line corresponds to a fit to the mock data, the dashed line recalls the best fit from Fig. 6, and the dotted lines indicate uniform depletion times of 0.1, 1, and 10 Gyr from top to bottom. Right panel: correlation between the SFR and the molecular gas mass of the PHIBSS2 z = 0.5 − 0.8 together with the corresponding distribution of the non-correlated mock sample. The PHIBSS2 sample and the resulting fit are indicated in red, while the mock sample is displayed as open blue circles.
Current usage metrics show cumulative count of Article Views (full-text article views including HTML views, PDF and ePub downloads, according to the available data) and Abstracts Views on Vision4Press platform.
Data correspond to usage on the plateform after 2015. The current usage metrics is available 48-96 hours after online publication and is updated daily on week days.
Initial download of the metrics may take a while.


