Fig. 6.
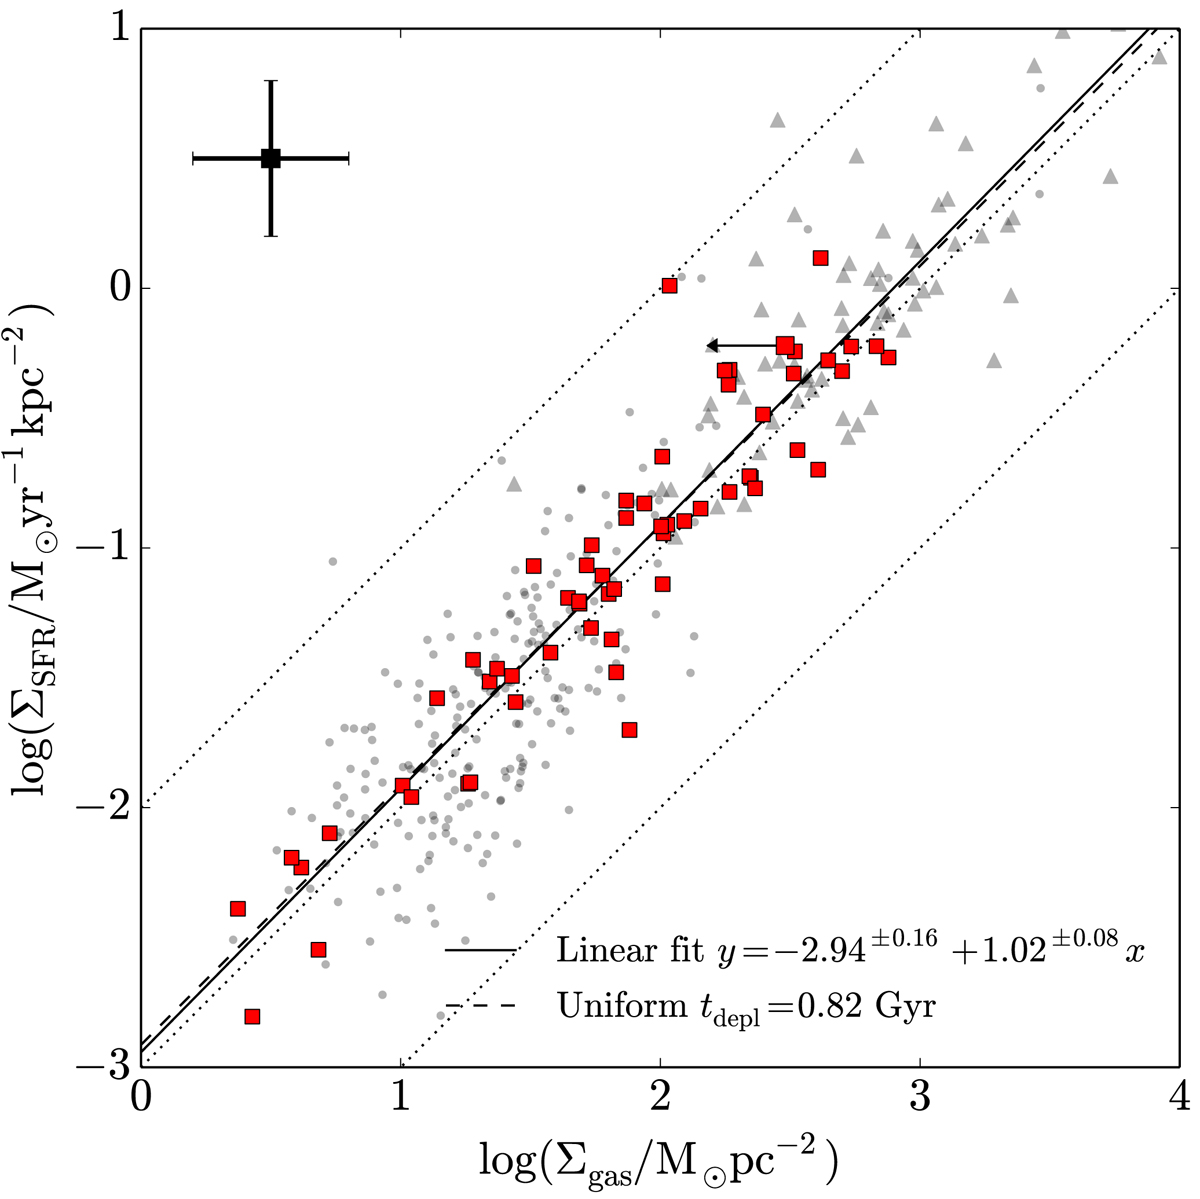
Kennicutt–Schmidt relation for the galaxies of the PHIBSS2 sample at z = 0.5 − 0.8. The dotted diagonal lines correspond to constant depletion times of 0.1, 1, and 10 Gyr from top to bottom and the 0.3 dex errors assumed to assess the uncertainties are displayed at the upper left. The observed PHIBSS2 z = 0.4 − 0.8 data points are indicated by squares and the upper limit by an arrow. The underlying grey points correspond to COLDGASS data (Saintonge et al. 2011a, 2012) and the grey triangles to PHIBSS (Tacconi et al. 2013). The black solid line corresponds to a linear least-square fits to the data points; the dashed lines to a uniform depletion time corresponding to the best-fitting value on the KS diagram. The Pearson correlation coefficient is 0.94 while the standard deviation from the linear fit is 0.24 dex.
Current usage metrics show cumulative count of Article Views (full-text article views including HTML views, PDF and ePub downloads, according to the available data) and Abstracts Views on Vision4Press platform.
Data correspond to usage on the plateform after 2015. The current usage metrics is available 48-96 hours after online publication and is updated daily on week days.
Initial download of the metrics may take a while.