Fig. 5.
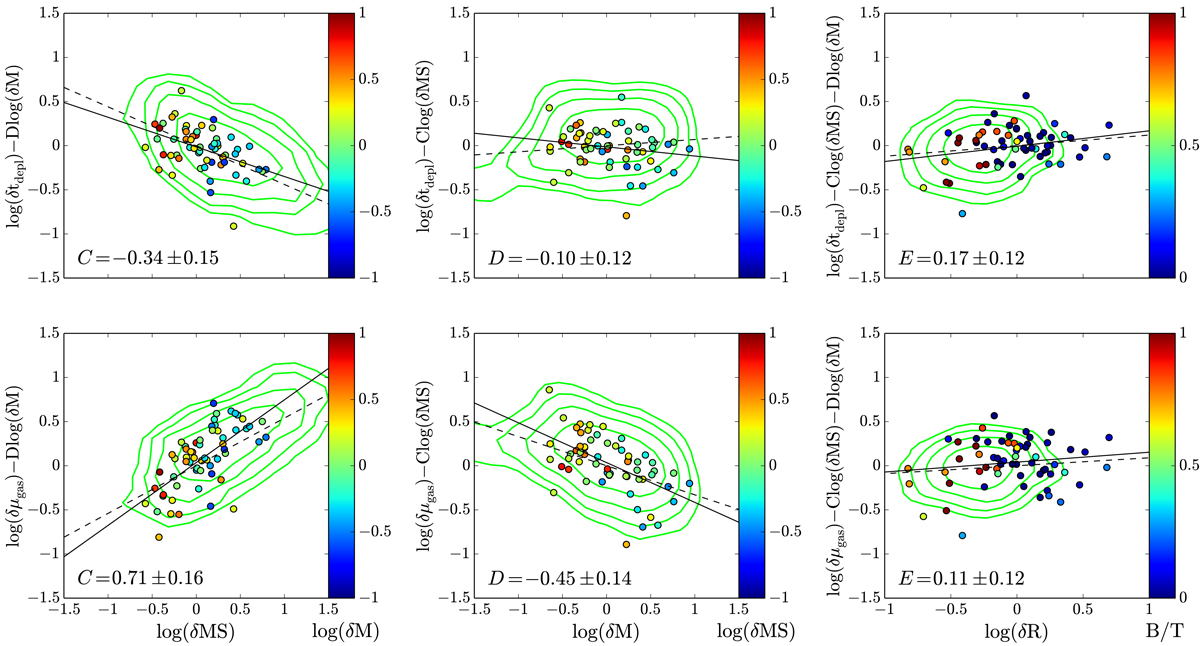
Dependence of the residual molecular depletion time and gas-to-stellar-mass ratio after subtraction of the redshift dependence on the distance from the MS, stellar mass, and disc size within the PHIBSS2 z = 0.5 − 0.8 sample, compared to the dependences derived from the scaling relations obtained by Tacconi et al. (2018). We assume that the different variables can be separated as in Eqs. (9) and (10), and plot each dependency independently. The black solid lines and the values indicated on the plots refer to the best fits for the z = 0.5 − 0.8 subsample, while the green contours and the dashed lines correspond to the comprehensive data set studied by Tacconi et al. (2018) and its fitting formulae (C = −0.44 ± 0.04, D = +0.07 ± 0.05 and E = +0.12 ± 0.12 for tdepl and C = +0.54 ± 0.03, D = −0.32 ± 0.03 and E = +0.09 ± 0.09 for μgas).
Current usage metrics show cumulative count of Article Views (full-text article views including HTML views, PDF and ePub downloads, according to the available data) and Abstracts Views on Vision4Press platform.
Data correspond to usage on the plateform after 2015. The current usage metrics is available 48-96 hours after online publication and is updated daily on week days.
Initial download of the metrics may take a while.