Fig. 4.
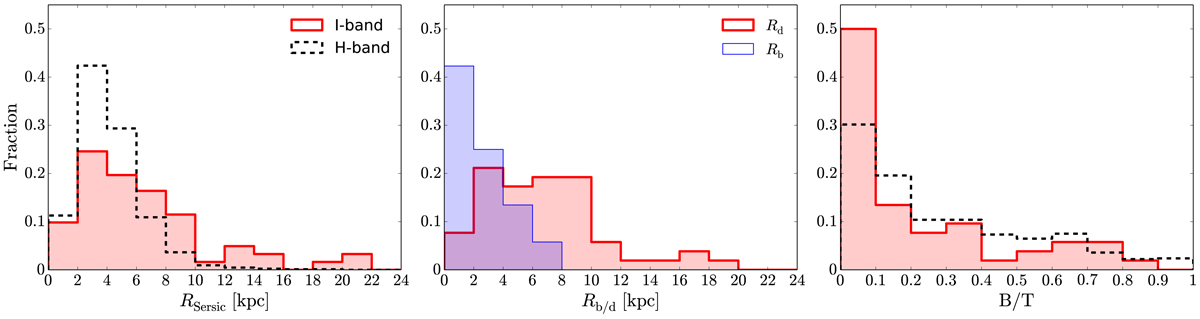
Distributions of the single-Sérsic, disc, and bulge half-light radii together with the bulge-to-total luminosity ratio of the PHIBSS2 z = 0.5 − 0.8 sample determined with galfit from their HST/ACS I-band images. In the middle and right panels, we only consider galaxies with B/T ≠ 1. The black dashed lines show the corresponding parent CANDELS/3D-HST H-band distributions at z = 0.5 − 0.8 with 10 < log(M⋆/M⊙)< 11.8 and |log(δMS)| < 1 (van der Wel et al. 2012; Lang et al. 2014).
Current usage metrics show cumulative count of Article Views (full-text article views including HTML views, PDF and ePub downloads, according to the available data) and Abstracts Views on Vision4Press platform.
Data correspond to usage on the plateform after 2015. The current usage metrics is available 48-96 hours after online publication and is updated daily on week days.
Initial download of the metrics may take a while.