Fig. 1.
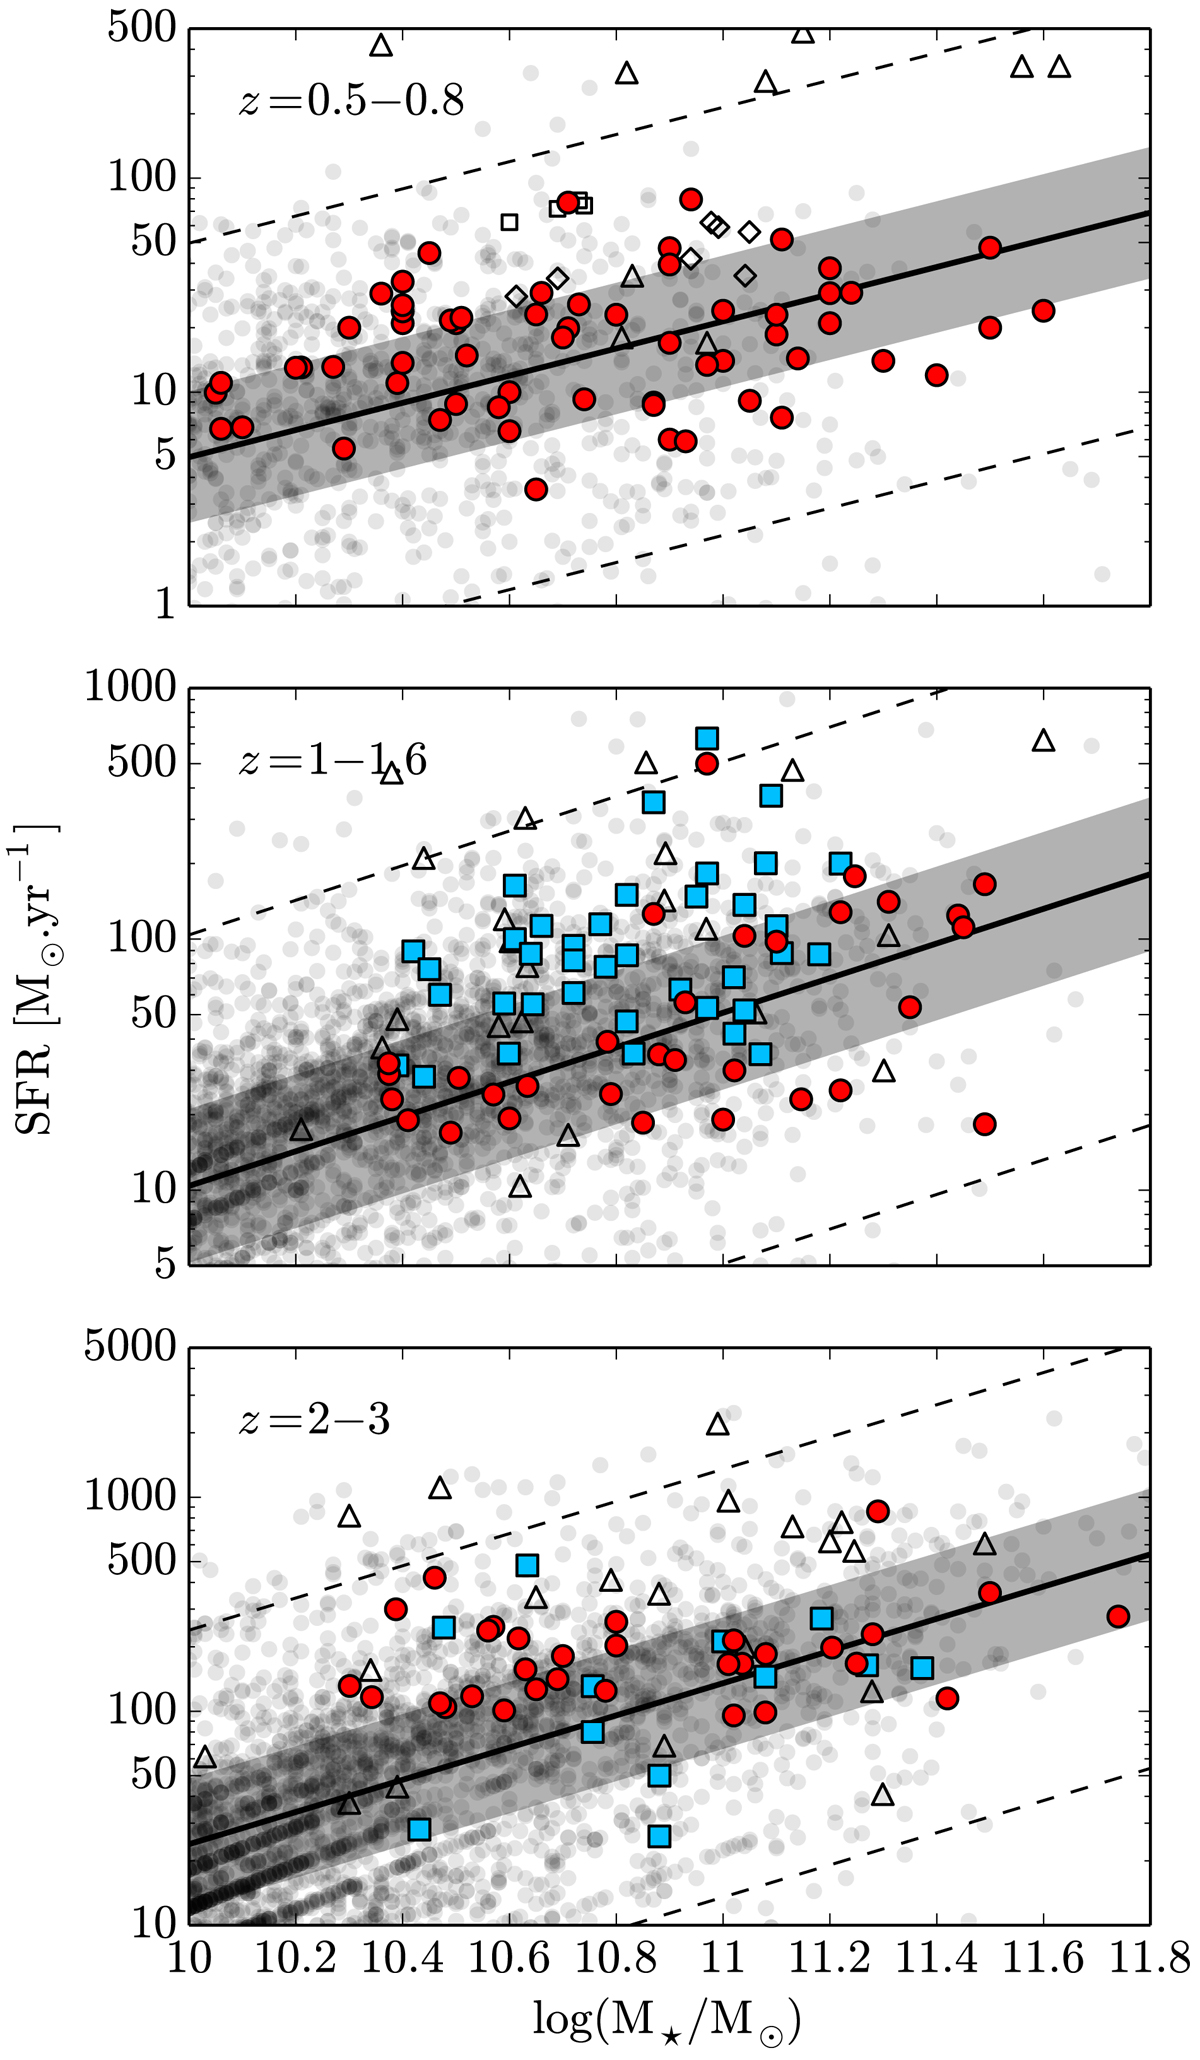
Location of the PHIBSS2 sample in the three redshift ranges z = 0.5 − 0.8, z = 1 − 1.6 and z = 2 − 3 as a function of stellar mass M⋆ and SFR. The PHIBSS2 galaxies at z = 0.5 − 0.8 presented in this paper and the targets in the other redshift ranges are all marked as plain red circles. The PHIBSS sample (Tacconi et al. 2010, 2013) is indicated as plain blue squares while other existing CO measurements in the same redshift ranges are displayed as open triangles, including ULIRGs at z = 0.5 − 0.8 observed with the IRAM 30 m telescope (Combes et al. 2011, 2013), near MS star-forming galaxies in the range z = 0.5 − 3 (Daddi et al. 2010a; Magdis et al. 2012a; Magnelli et al. 2012), above MS submillimeter galaxies in the range z = 1.2 − 3 (Greve et al. 2005; Tacconi et al. 2006, 2008; Bothwell et al. 2013) and lensed MS galaxies in the range z = 1.2 − 3 observed with the IRAM PdBI (Saintonge et al. 2013, and references therein), as well as additional sources between z = 1 and z = 2.5 observed with ALMA and NOEMA (Silverman et al. 2015; Decarli et al. 2016); Genzel et al. (in prep.). The upper panel also shows sources observed by Geach et al. (2011) at z ∼ 0.4 as open diamonds and Bauermeister et al. (2013) at z ∼ 0.5 as open squares. The background data points correspond to 3D-HST galaxies in the AEGIS, GOODS-North, COSMOS and UDS fields (Brammer et al. 2012; Momcheva et al. 2016), while the solid line highlights the mean MS line from Speagle et al. (2014) in each redshift range. The shaded area corresponds to the 0.3 dex scatter of the MS and the dashed line to ±1 dex.
Current usage metrics show cumulative count of Article Views (full-text article views including HTML views, PDF and ePub downloads, according to the available data) and Abstracts Views on Vision4Press platform.
Data correspond to usage on the plateform after 2015. The current usage metrics is available 48-96 hours after online publication and is updated daily on week days.
Initial download of the metrics may take a while.