Fig. 2.
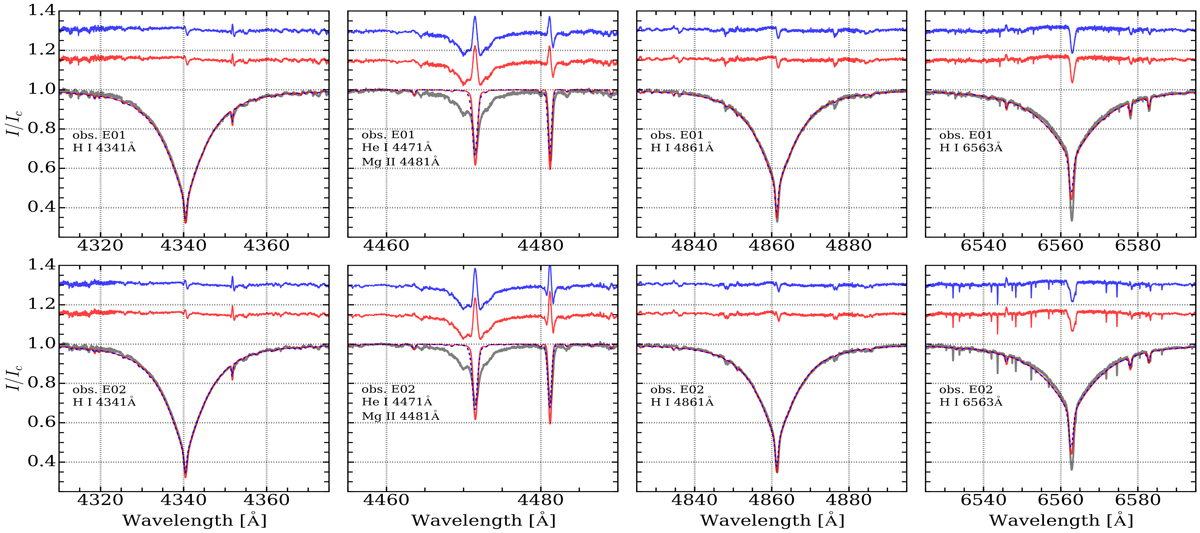
Comparison between two ESPaDOnS spectra of o Lupi, taken two months apart (shown in gray), and synthetic ATLAS9/COSSAM_SIMPLE spectra. The red line is the synthetic spectrum for a single star with Teff = 15 000 K, log g = 3.8 dex, and v sin i = 35 km s−1, and the blue line is the synthetic spectrum for a binary star with Teff, 1 = 17 000 K, Teff, 2 = 14 000 K, log g1 = 3.9 dex, log g2 = 3.8 dex, v sin i1 = 50 km s−1, v sin i2 = 25 km s−1, RV1 = −5 km s−1, RV2 = +5 km s−1, and a light fraction of 50%. Residuals to the fit are indicated with the same color coding and a small offset for increased visibility. Top row: observed spectrum E01; bottom row: E02 (see also Table A.2).
Current usage metrics show cumulative count of Article Views (full-text article views including HTML views, PDF and ePub downloads, according to the available data) and Abstracts Views on Vision4Press platform.
Data correspond to usage on the plateform after 2015. The current usage metrics is available 48-96 hours after online publication and is updated daily on week days.
Initial download of the metrics may take a while.