Fig. 4
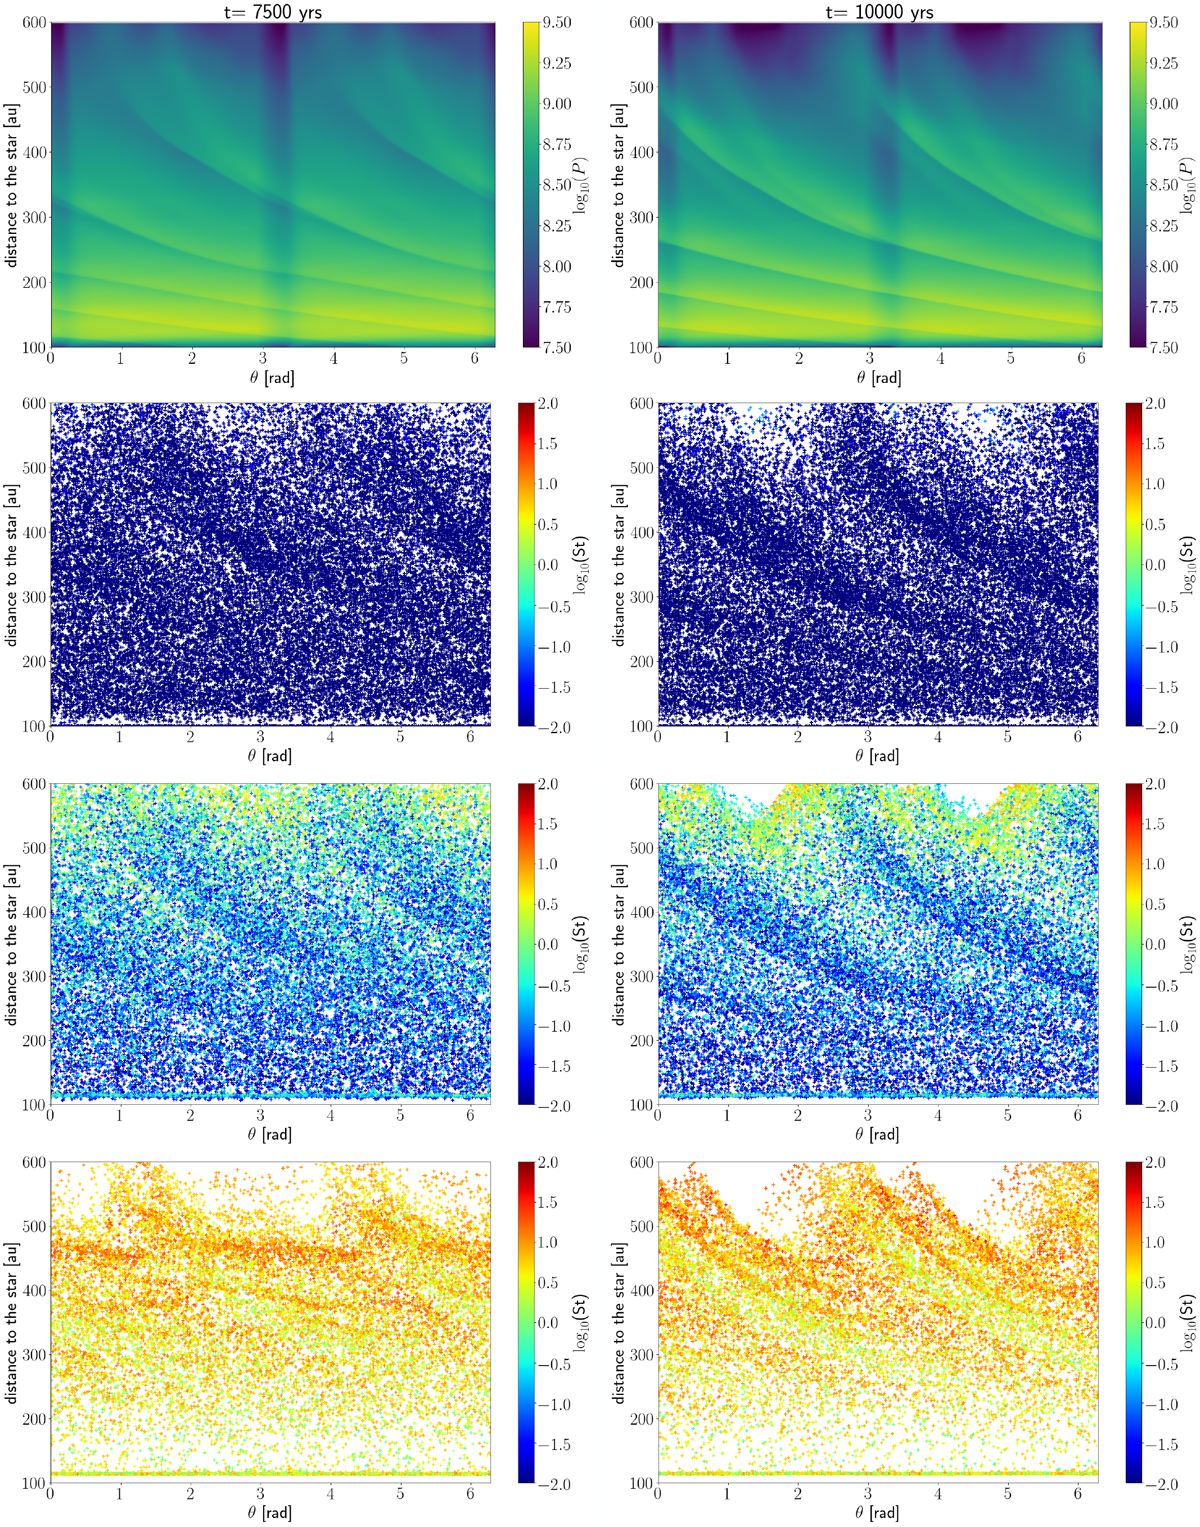
Gas and dust distributions in the (r,θ)-plane after 7500 (left panels) and 10 000 (right) yr of evolution. Top row: vertically integrated pressure map of the disc. The rows below show the dust distribution coloured with the logarithm of the Stokes number – from top to bottom panels: 100 μm, 1 mm, 1 cm.Spirals in the gas and in the dust have the same morphology.
Current usage metrics show cumulative count of Article Views (full-text article views including HTML views, PDF and ePub downloads, according to the available data) and Abstracts Views on Vision4Press platform.
Data correspond to usage on the plateform after 2015. The current usage metrics is available 48-96 hours after online publication and is updated daily on week days.
Initial download of the metrics may take a while.